Ask three traders on the same desk why they used a market order and you will get three answers, all of them reasonable, none of them written down anywhere. That is not a competence problem. It is a documentation problem, and it becomes a real problem the first time a position goes wrong and someone from outside the desk asks why this order was worked over an hour and that one was crossed in a second.
The fix is a grid. Rows are liquidity states, columns are permitted order types and a maximum participation rate, and the cells are decided in advance by people who are not under time pressure. Below is how to build one where the measurement is reproducible, and an honest account of which parts the platform gives you and which parts you have to construct yourself.
The grid replaces undocumented discretion, not judgement
Worth separating those two, because the objection you will hear from the desk is that a grid cannot anticipate everything, and the objection is correct.
A grid is not an attempt to remove judgement. It is an attempt to make the default explicit and to make departures from it visible and cheap to explain. The trader who deviates is not doing something wrong. The trader who deviates and leaves no trace is, because six weeks later nobody including the trader can reconstruct what the market looked like at the time, and the review becomes an exercise in recollection rather than evidence.
So the grid has two components of equal weight. The matrix, which sets the default. And the override log, which records departures at the moment they happen. A matrix without a log is a wall poster.
What the Terminal measures, and what it does not
Being precise here matters, because a state definition built on a measurement that is not actually available is worse than no grid at all.
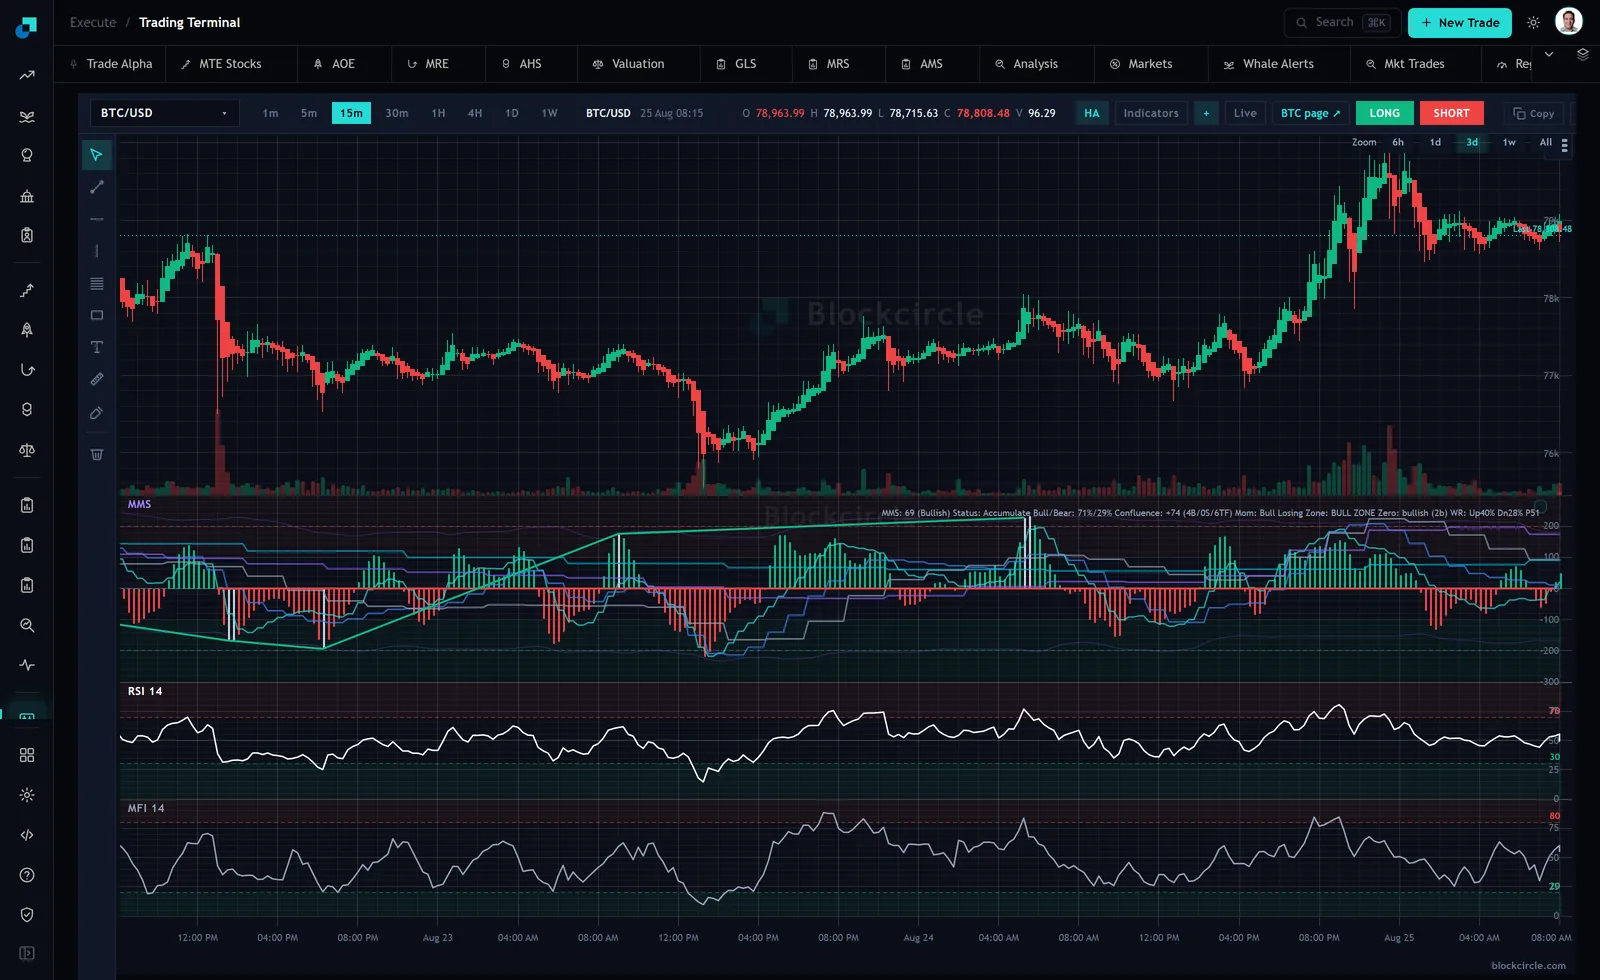
What is available. A timeframe selector running 1m, 5m, 15m, 30m, 1H, 4H, 1D and 1W, which lets you fix the bucket your volume measurement uses. An OHLCV strip that publishes the volume for the selected bar, reading V 96.29 against the 15 minute bar timestamped 25 Aug 08:15 in the capture above, alongside open, high, low and close of 78,963.99, 78,963.99, 78,715.63 and 78,808.48. A volume histogram under the price pane giving you the recent distribution of that figure by eye. An MFI 14 pane, which is a volume-weighted oscillator and therefore carries some volume information rather than pure price.
What is not available, and what you must not build a state definition on. There is no depth of book here, no spread reading, no queue position, and no participation figure against real-time traded volume. The MMS pane, which at capture displayed a directional readout with a score, a bull and bear split and a confluence figure, is a momentum construct. It is not a liquidity measure and putting it into a liquidity state definition would be a category error that any reviewer with execution experience will pick up immediately.
The practical consequence is that the Terminal gives you the volume half of the state and the venue gives you the spread and depth half. Your state definition has to name both sources, and the grid document has to say where each number comes from and at what refresh.
Defining states so two people get the same answer
A state definition is only useful if it is reproducible by someone who was not in the room. Three properties make it so.
It is relative, not absolute. A raw volume of 96.29 base units in a fifteen minute bar means nothing without a reference. State the measurement as the current bar volume against the median bar volume for the same instrument, same timeframe, same time of day, over a stated lookback. Time of day matters enormously and omitting it is the most common way these definitions break.
It is bucketed with explicit boundaries and an explicit tie rule. Three states are usually enough and four is the practical maximum. More than that and the desk stops consulting the grid.
It is measured at a stated moment, which should be immediately before order entry rather than at signal generation. Those are different times, and on a fast instrument they can be different regimes.
A workable definition, with your own numbers substituted for the placeholders, reads like this. Deep is current bar volume at or above the time-of-day median with the venue's quoted spread inside its own recent normal range. Normal is between half the median and the median. Thin is below half the median, or any period where the spread reading exceeds the boundary you have set, whichever triggers first. The whichever-triggers-first clause matters, because thinning shows up in the spread before it shows up in the volume.
The matrix, with the participation cap doing the real work
Here is the shape. The cells are illustrative and the numbers must be yours, derived from your own fill history in your own instruments.
| Liquidity state | Permitted order types | Maximum participation | Escalation trigger |
|---|---|---|---|
| Deep | Market permitted for orders under the small-order threshold, limit and scheduled participation above it | Set from your own fill data, applied per interval rather than per day | Order exceeds the small-order threshold by a stated multiple |
| Normal | Limit and scheduled participation only, market by exception | Materially below the deep-state cap | Any market order, without exception |
| Thin | Limit only, resting, with a defined maximum working period | Lowest cap in the grid | Any order at all above the small-order threshold |
The participation cap is the part that does the work and the part most grids omit, because an order type on its own constrains nothing about size. A limit order for the entire day's volume is not a conservative order. Express the cap as a fraction of traded volume over a stated interval, and specify the interval, because a twenty percent cap measured over a day and the same cap measured over five minutes are not remotely the same instruction.
The escalation column is what converts the grid from advice into policy. It names the condition under which the trader stops and gets a second person, and it should be conservative enough that escalations actually happen. A grid whose escalation trigger fires twice a year is calibrated wrong.
The override log, and what makes it real rather than decorative
Six fields, captured at the time of the override and not reconstructed afterwards. The instrument and side. The state the grid assigned. The order type actually used. The measurement readings that were on screen, meaning the timeframe, the bar volume and the spread. One sentence of reasoning. The name of the person who approved it if the escalation trigger fired.
Three design choices separate a log that gets used from one that gets abandoned. Make it takeable in under thirty seconds, because a log that costs two minutes will be filled in at the end of the day from memory, which defeats the point. Review it monthly as a set rather than incident by incident, since the value is in the pattern. And treat a repeated override as evidence about the grid rather than about the trader: if the same cell is overridden every time, the cell is wrong and the correct response is to amend it and date the amendment.
The three places the grid will fail you
Say these out loud when the policy is approved, so that nobody is surprised later.
Thinly traded instruments where the median bar volume is itself small make the relative measurement unstable, and a state that flickers between normal and thin on adjacent bars gives the desk no usable default. For those names, set the state manually at the start of the session and hold it.
Scheduled events break the time-of-day baseline entirely. Define an event window during which the grid is suspended in favour of a stated event rule, and define it by calendar in advance rather than by judgement in the moment.
And the state can change while an order is working, which is the case the matrix cannot express because it assigns a state once. Handle it with a standing instruction rather than a cell: if the state deteriorates by one level while an order is live, the working order pauses and the trader re-enters the grid. That instruction has to be written down too, because it is the situation in which a trader is least likely to stop and look anything up.