A nominal policy rate is not a stance. It is a number that can sit at the same level while the stance moves from accommodative to restrictive without the committee touching anything, purely because inflation fell. Any policy component built on the nominal level will therefore misclassify long stretches of history, and it will do so most badly in exactly the periods where inflation is moving fastest and the classification matters most.
The standard correction is to work in real terms and to measure the result against an estimate of the neutral rate. That is the right correction. It also converts a single observable into a construct resting on two unobservables, and the discipline of this article is about carrying that honestly through a live process rather than quietly picking values and reporting a clean number.
What the substitution buys and what it costs
The gain is that the measure now has an interpretation. A real rate above neutral is restrictive, below is accommodative, and the distance is a quantity you can track, compare across cycles and compare across jurisdictions. None of that is available from the nominal level.
The cost is arithmetic and unavoidable. The real rate requires an inflation measure, and if you use expected rather than realised inflation you have picked up a second construct with its own measurement debate. The neutral rate is not observed at all. It is the output of models, the published estimates disagree with each other, and each of them is revised, including revisions that change what the estimate said about periods that are already history.
So a single point estimate of restrictiveness is the product of at least two contestable choices, and the sensitivity of the output to those choices is frequently larger than the quantity being measured. That is not an argument against the measure. It is an argument for reporting it as a band and for keeping the assumption contribution visible.
Where the module sits in this
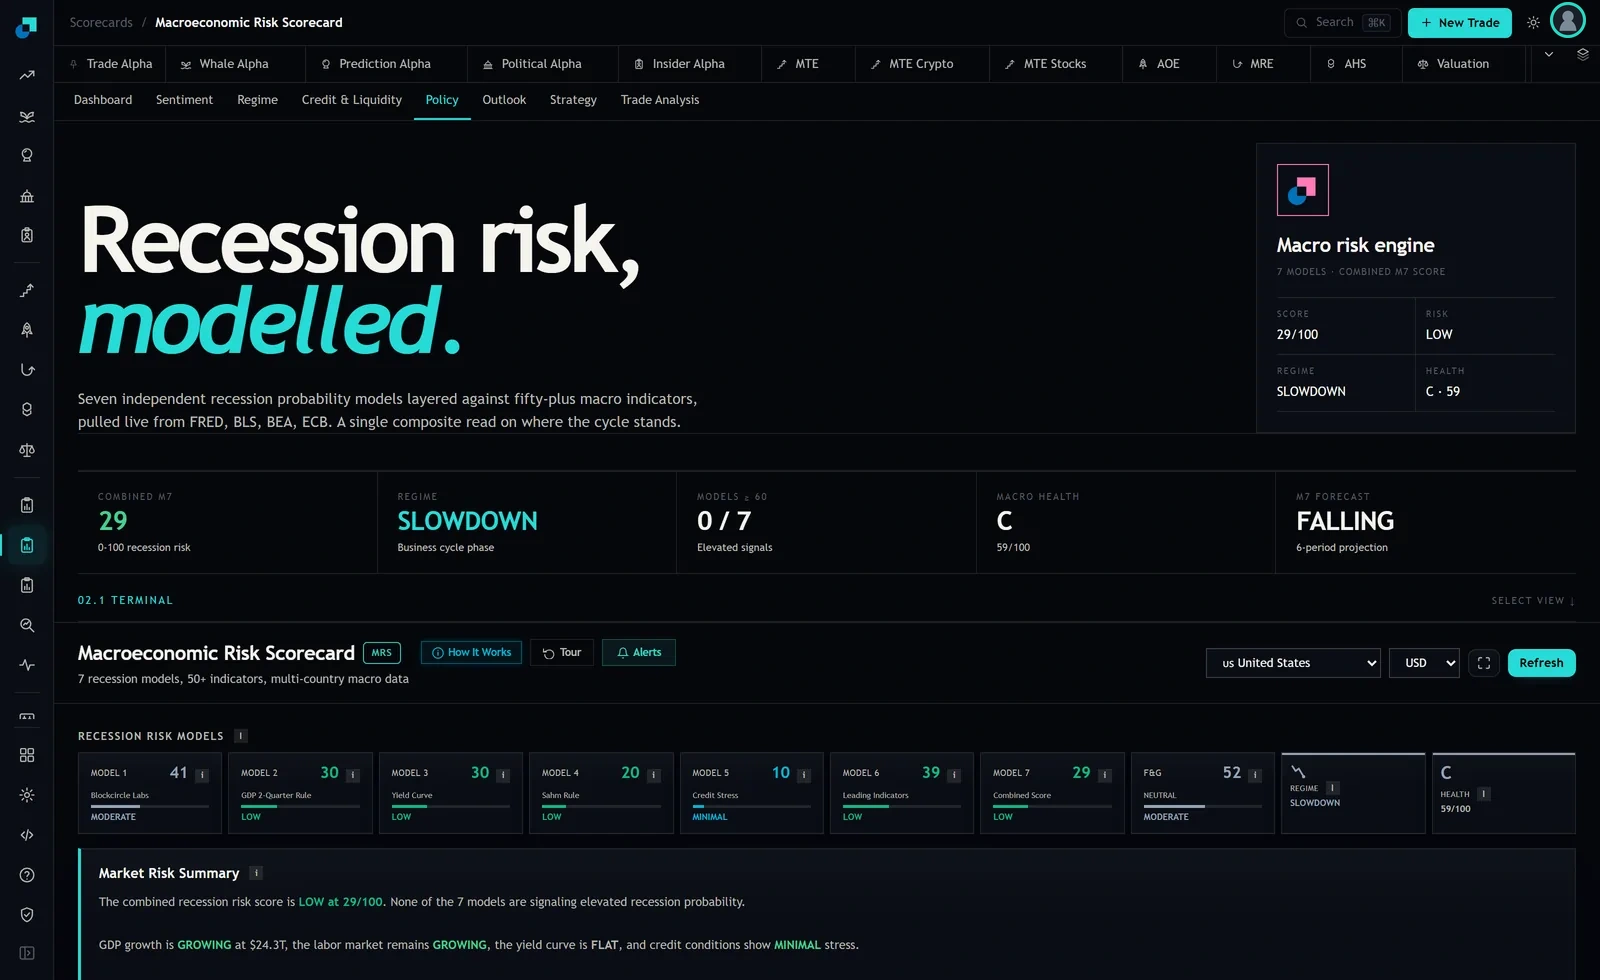
The Macro Risk Scorecard's stated coverage includes Federal Reserve policy, Treasury yields, and inflation data, alongside interest rate forecasting and yield curve analysis, drawn from sources including FRED, BLS, BEA and the ECB across a multi-country set. Those are the raw inputs a restrictiveness read consumes.
What the visible page presents is a state read on outcomes rather than a stance read. The header carries a combined M7 score of 29 out of 100 tagged LOW, a regime label of SLOWDOWN, a macro health grade of C at 59, a counter of 0 out of 7 models at or above the elevated threshold, and a forecast tile reading FALLING over a stated six-period projection. Those are consequences. The stance measure described here is an input you construct and maintain alongside them, and I would rather say that than imply the page hands you a neutral rate estimate it does not display.
Decomposing a move into data and assumption
This is the piece that turns the measure from a talking point into something a committee can govern, and it is straightforward to compute.
Between any two reporting dates, hold your assumptions at the earlier values and recompute the measure with the later data. The change is the data contribution. Then hold the data at the later values and move the assumptions to their later values. The change is the assumption contribution. Report both lines every month.
The value of doing this becomes obvious the first time a published neutral rate estimate is revised. Your restrictiveness reading moves, the pack shows it moving, and without the decomposition the committee reads that as the economy having changed. With the decomposition, the line says plainly that the data did nothing and a third party revised a model. Those warrant entirely different responses, and I have seen the undecomposed version drive a real allocation change on what was, in substance, somebody else's methodology update.
Extend the same logic to the inflation limb. If you deflate by a survey measure and the survey is revised, or you deflate by a market-implied measure and the liquidity premium in that market shifts, the stance reading moves for reasons that have nothing to do with policy or the economy.
Carrying the band, and what it does to a threshold rule
Run the calculation across at least three independent published neutral estimates plus a fixed constant assumption as a control, and carry the resulting range rather than a central value. The width of that range is information in its own right and it is not stable over time.
Then confront what the band does to any rule you had planned to build on the measure. A binary flag, restrictive or accommodative, is only well defined when the whole band sits on one side of neutral. When the band straddles zero, the honest reading is that the stance is indeterminate on current estimates, and the process should have a third state for that rather than defaulting to whichever side the central estimate happens to fall on.
The three-state version is less satisfying and considerably more defensible. It also has a useful operational property: an indeterminate reading is an explicit instruction to size any position taken on the stance view smaller, rather than an invisible reduction in confidence that never reaches the position sizing.
Assumption drift, and how it gets into a live process
The failure mode that matters over a multi-year horizon is not a wrong assumption. It is an assumption that changed without anybody deciding to change it.
Three routes in, all common. The first is a data provider updating its published neutral rate series, which silently rewrites your history the next time you refresh. The second is a switch of inflation measure made for a good local reason, such as a series being discontinued, that then propagates through every historical comparison. The third is the slow one: a portfolio manager who has formed a private view that neutral is higher than published estimates, and whose commentary gradually reflects that view while the model in the pack still uses the published number.
The defences are dull and they work. Freeze the vintage of every external estimate at each reporting date and store it, so that a historical reading can be reproduced exactly as it stood. Keep a dated assumption register with a named owner for each entry, and require a written note for any change, including the reason and the recomputed history alongside the original. Recompute the previous twelve months on both the old and new assumption whenever anything changes, and put both series in the pack for one cycle.
None of this stops anyone from being wrong about neutral. It stops the organisation from being wrong about what it believed six months ago, which is the version that damages a review.
What the sensitivity table looks like in the pack
One table, four rows, and it goes in front of the commentary rather than in an appendix.
Row one is the current real policy rate under the fixed inflation definition. Row two is the range of neutral estimates in use with each source named. Row three is the implied restrictiveness distance under each, with the sign flagged where sources disagree on direction. Row four is the month-on-month change split into the data contribution and the assumption contribution.
Beside it, one sentence stating what would have to be true for the sign to flip. If a shift of a quarter point in the neutral estimate reverses the conclusion, the reader needs to know that on the same page as the conclusion, because a quarter point is well inside the range across published estimates and well inside the range of a single estimate's own revisions.
The discipline this enforces is the point of the whole exercise. A desk that has been shown, every month, how much of its restrictiveness read is assumption rather than measurement will not build a large position on the measure. A desk that has only ever seen the central estimate will, and it will not be able to explain afterwards which part of the thesis failed.