If you have spent any time on Prediction Alpha you have probably noticed that the platform cannot seem to agree with itself about how many markets exist. The stats tab leads with one number, the markets tab header leads with a different one, and a chart further down the stats page implies a third that is larger than both. It is easy to read that as sloppiness. It is not, and treating it as a bug means missing the actually useful lesson, which is that every one of those counters is answering a different question and you have to pick the right one before you divide anything by it.
Four counts on two screens
Here is what the module showed me on a single capture, all on the same day.
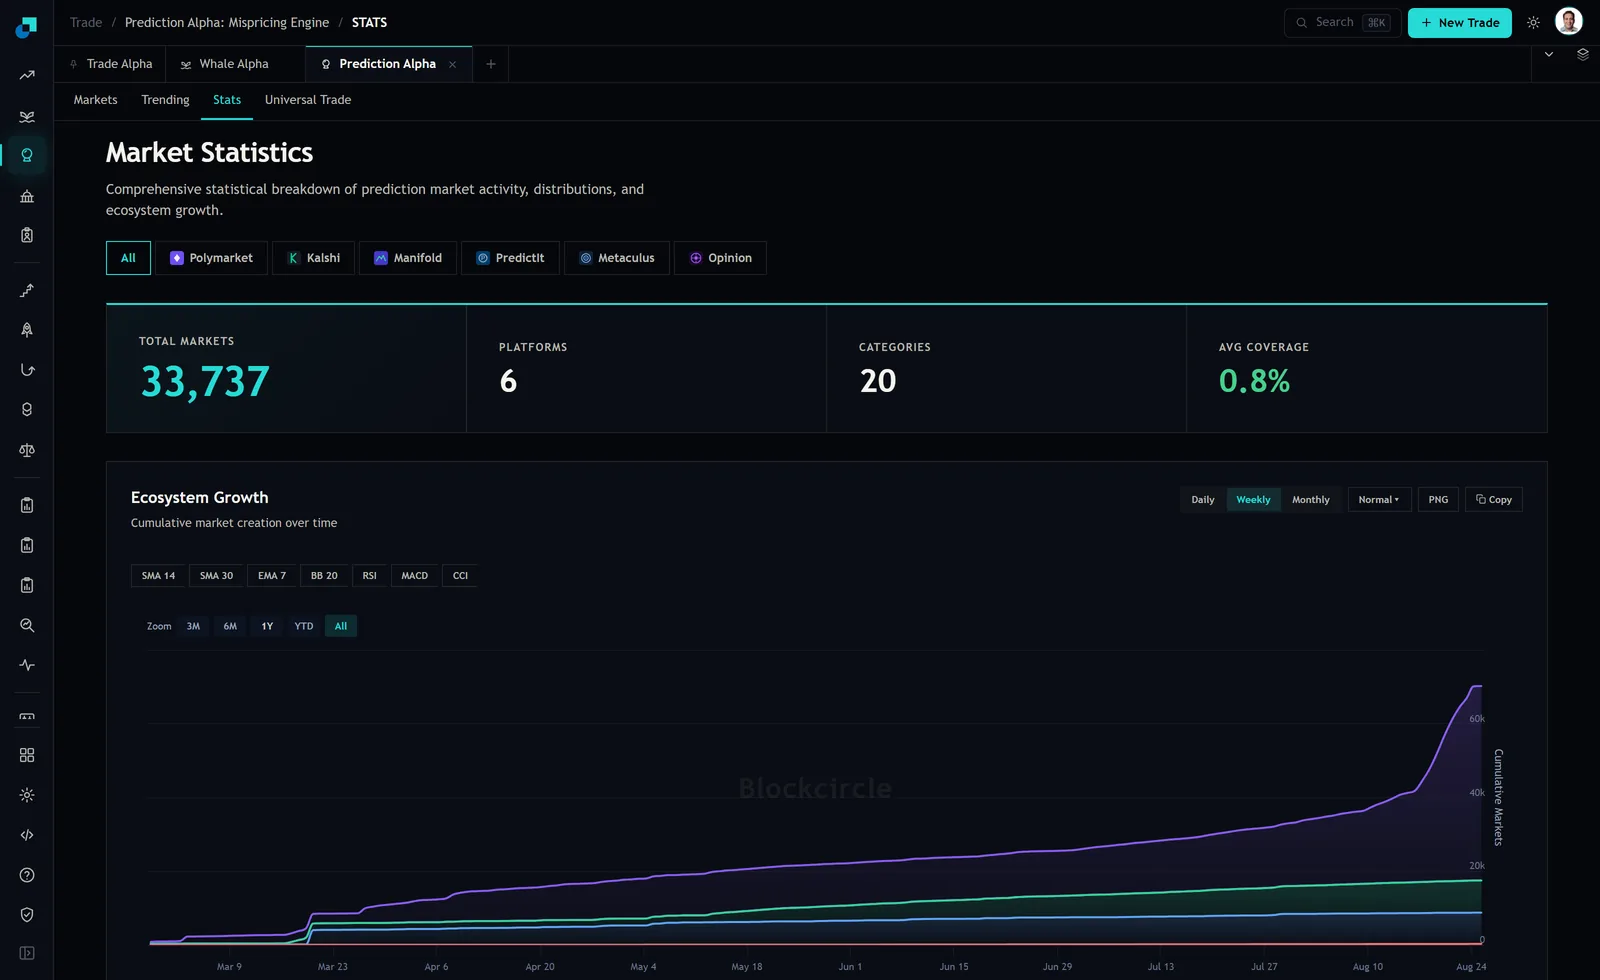
- The stats tab headline tile: TOTAL MARKETS 33,737. Alongside it, PLATFORMS 6, CATEGORIES 20, AVG COVERAGE 0.8 percent.
- The markets tab header: MARKETS INDEXED 56.2K, described as across 6 venues. Next to it, DISPLAYED 1.0K, described as after filters, and the table itself is labelled 1,000 markets.
- The platform distribution pie on the stats page: Polymarket 76,785, Kalshi 28,237, Manifold 8,837, PredictIt 574, Metaculus 566, Opinion 286. Those sum to 115,285.
- The category breakdown bar chart on the same page, twenty buckets running from 47,154 at the top down to 24 at the bottom. Those sum to 115,140.
So the two charts on the stats page agree with each other to within about a tenth of a percent, and neither of them agrees with the headline tile at the top of the very same page. The headline is under a third of what the charts below it count.
What each counter is plausibly counting
I want to be careful here, because the page does not label its denominators and I am reading tea leaves alongside everyone else. What follows is a hypothesis that fits the readings, not something the screen confirms.
The pattern looks like a ladder of increasingly restrictive filters. The 115,285 in the charts behaves like everything the platform has ever indexed across the six venues, including contracts that have already resolved. The 56.2K on the markets tab header behaves like the set currently retained in the live feed. The 33,737 on the stats tile behaves like whatever narrower inclusion rule that page applies, which is very plausibly the set of contracts still open.
The ecosystem growth chart on the same page is consistent with this. It plots cumulative market creation on a window that opens on 9 March 2026, and its leading series clears sixty thousand by late August. A cumulative creation count that reaches sixty thousand in under six months, on one venue, sits comfortably inside a 115,285 all time total and nowhere near a 33,737 one. Listing supply on this asset class is enormous and most of it is historical, which is exactly what you would expect when every fixture and every candidate is its own contract.
Test it yourself rather than taking my word for it, because it is a five minute check. Use the venue filter chips at the top of the stats page to switch to one platform at a time and see whether the headline tile moves to that platform's pie slice or to something smaller. If it lands on something smaller, the tile is applying a status filter the pie is not.
Average coverage is an average of ratios, not a ratio of totals
The same denominator problem shows up in the fourth tile, and this one is worth understanding because the tile is the number people quote.
Scroll to the analysis coverage panel at the bottom of the stats page and it reports coverage per venue: Opinion 6 of 286 at 2.1 percent, Polymarket 1,480 of 76,785 at 1.9 percent, PredictIt 3 of 574 at 0.5 percent, Kalshi 53 of 28,237 at 0.2 percent, Metaculus 1 of 566 at 0.2 percent, Manifold 7 of 8,837 at 0.1 percent.
Add the numerators and you get 1,550 analyses. Add the denominators and you get 115,285, which is the pie total again. Divide one by the other and the pooled coverage rate is about 1.3 percent. Now take the plain average of the six percentages instead: 2.1 plus 1.9 plus 0.5 plus 0.2 plus 0.2 plus 0.1, over six, which is 0.83. That rounds to the 0.8 on the tile.
So the tile is consistent with an unweighted mean of the six venue rates rather than a pooled rate, and the two differ by more than half again. Neither is wrong. They answer different questions. The mean of rates tells you how well covered a typical venue is, giving Opinion's 286 listings the same vote as Polymarket's 76,785. The pooled rate tells you the chance that a randomly chosen listing has an analysis attached. If you are asking the second question and you quote the first number, you are off by a factor of one and a half in the direction that makes the platform look thinner than it is.
The denominator a base rate actually needs
This is where the whole thing becomes practical, because the reason to care about counters is that people build base rates out of them and then bet on the base rates.
Say you want to claim something like a share of contracts in some category resolve yes, or a share of markets priced under ten cents pay out. The denominator for that claim has to satisfy three conditions and none of the four counters above satisfies all of them on its own.
It has to match your filter exactly, so if your claim is about open politics contracts on two venues, your denominator is open politics contracts on those two venues and nothing else. It has to be timestamped, because the universe is growing fast enough that a count from last month is a different population. And it has to be explicit about resolution status, because a base rate computed over resolved contracts and applied to open ones is comparing a settled population with a live one, and survivorship runs straight through the middle of that.
The uncomfortable implication is that none of the headline tiles is a legitimate denominator for a base rate, including the one that looks most authoritative. They are dashboard figures. The only number on the whole module that is definitionally the set you are looking at is the 1,000 displayed after your own filters on the markets tab, and even that is capped by the display rather than by the filter, which means it is a page of results and not a population.
Build the denominator instead of borrowing one
The workable habit is to stop reading counts off tiles entirely and start constructing them.
Set your filters on the markets tab so the visible set is exactly the population you want to make a claim about. Category chip, venue chips, and anything in the Filters panel that narrows it further. Note the displayed count, note the date, note every filter you applied, and save the view so you can reproduce it. That combination of a number and the recipe that produced it is worth more than any tile, because in three weeks you can re-run it and see what changed rather than wondering whether the platform's definition moved under you.
Then apply one discipline to any statistic you publish, share, or trade on: state the denominator in the same sentence as the ratio. Not eight percent of markets, but eight percent of the 340 open politics contracts on two venues visible on 25 August. It is a clumsier sentence and it is the difference between a claim someone can check and a number that sounds like a fact.
The four counters on this module are not a defect to be annoyed by. They are a useful reminder that on a platform aggregating six venues with different listing conventions, a count is always a count of something specific, and the specifics are where all the risk in the statistic lives.