Balance sheet runoff is harmless right up until it is not, and the transition is not gradual. That is the whole difficulty. For most of a tightening programme, reserves come out of the system and nothing observable happens, which teaches everyone involved that the programme has no consequences. Then the system reaches a level where the next dollar removed matters a great deal, and the change in behaviour arrives in days rather than quarters. Locating that level in advance is the job, and the first thing to accept is that you cannot do it by asking anyone what the number is.
Why the level is unknowable in advance, including to the people setting policy
Reserve demand is not a policy variable. It is a property of the banking system's plumbing, and it is assembled from things nobody publishes as a single number.
It depends on liquidity regulation, because banks hold reserves partly to satisfy ratios that treat reserves as the highest quality asset available. It depends on intraday payment needs, because a bank running large gross payment flows needs a buffer during the day even if its end-of-day position looks comfortable. It depends on how conservative individual treasurers are feeling, which is a preference and moves with the last stress event they remember.
Then there is distribution, which is the part most aggregate analysis misses entirely. Reserves can be perfectly ample in total while being scarce where they are needed, because the institutions holding the surplus are not the ones facing the shortfall and the market that moves reserves between them has frictions and limits of its own. A system-level number can look fine on the day a specific corner of the market cannot fund itself.
So the scarcity line is not a threshold sitting somewhere waiting to be discovered. It is a region that moves with regulation, with the calendar and with the distribution of balances, and any single number you write down for it will be wrong at some point in the cycle.
The detector is a price, and it is already on the dashboard
If the quantity that matters cannot be pinned down, watch what the quantity costs.
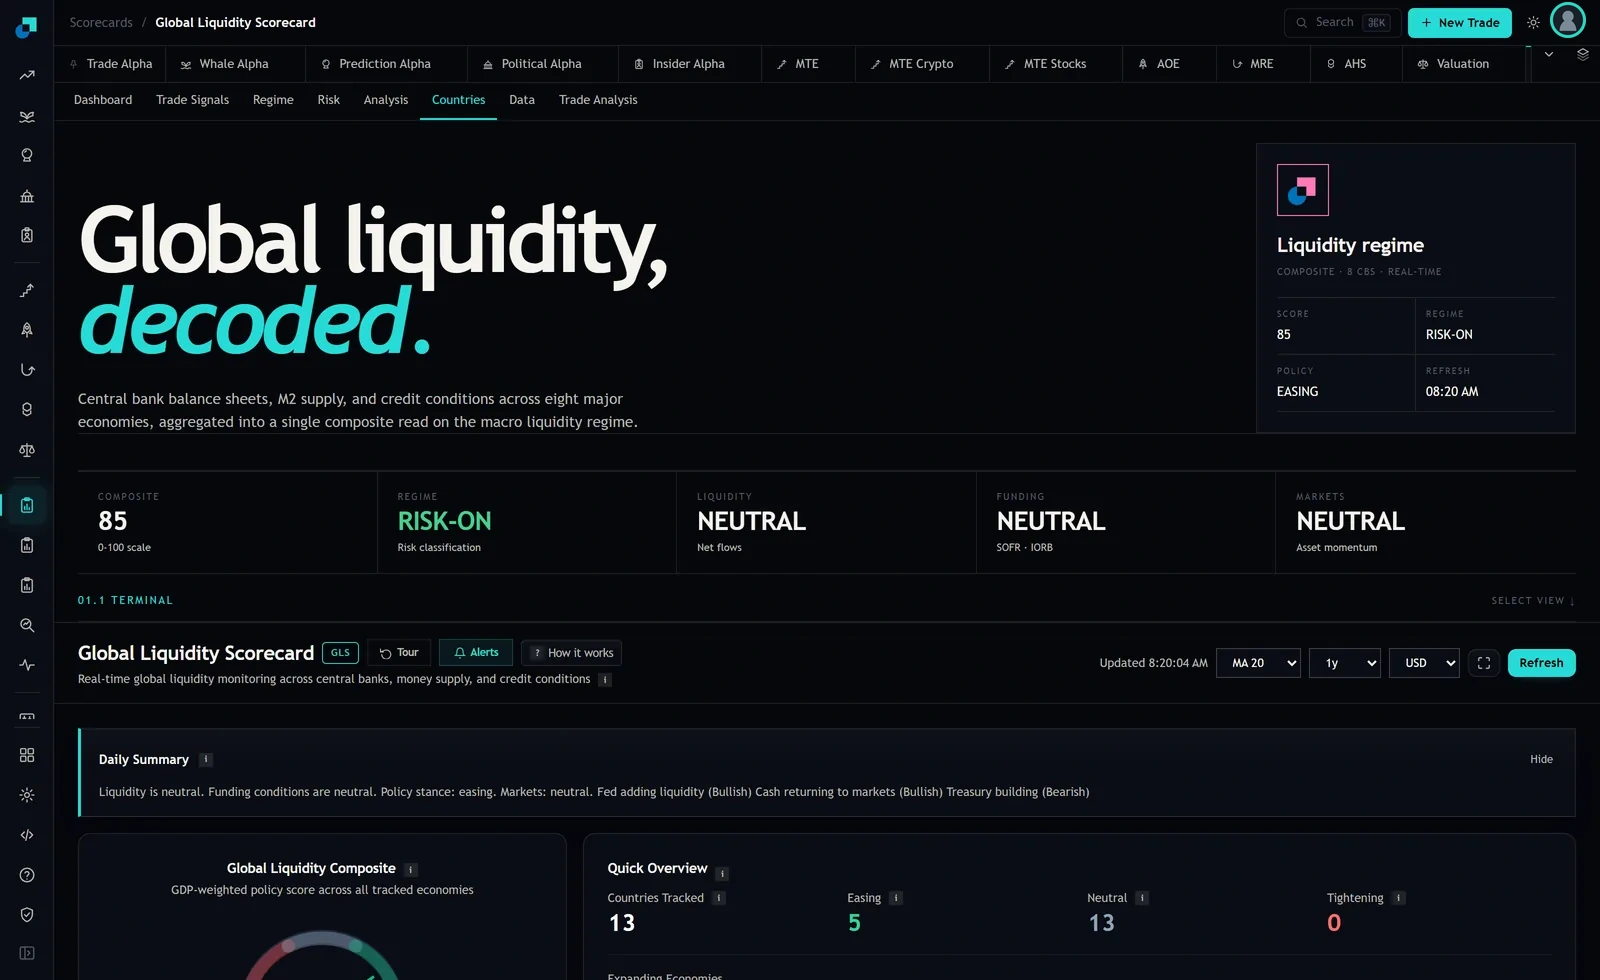
The strip across the top of the Global Liquidity Scorecard carries FUNDING as its own field, currently reading NEUTRAL, with its sub-label naming the SOFR and IORB relationship. That is the relationship between what secured overnight borrowing actually costs in the market and what the central bank pays banks on reserves. It is the price of reserves against their administered alternative.
The mechanism is direct rather than statistical. When reserves are abundant, an institution with surplus balances has no reason to lend them below what it earns sitting still, and the market rate has no reason to push above that. As the surplus thins, the institutions that need funding have to bid, and repo starts printing above the administered rate. The market is telling you it has become harder to source reserves, which is precisely the fact the quantity series is failing to convey.
Mapping the curve instead of guessing the point
The productive version of this exercise is not to find a threshold. It is to draw the curve and watch yourself move along it.
Plot the funding spread on one axis against the level of bank reserves on the other, using observations from the current operating framework only. For most of the range you will get a flat scatter. Reserves fall, the spread does not care. That flat region is the ample zone, and its existence is the reason a runoff programme can run for a long time with no visible effect.
What you are looking for is the point where the scatter stops being flat. Not a threshold value announced in advance, but a change in slope that appears in your own data as you approach it. This is a fundamentally different research posture than setting an alert level, and it is more useful, because the thing it tells you is how much room is left rather than whether a line has been crossed.
Two disciplines make the plot honest. Restrict it to the current framework, because administered rate structures and standing facilities have been changed and observations from a different framework are measurements of a different curve. And plot the dispersion of daily prints alongside the average, because the shape of the transition shows up in the spread of outcomes before it shows up in the mean.
The three-part detector worth actually monitoring
One number is not enough, and the additions are cheap.
- The level of the spread, measured against its own trailing distribution rather than against an absolute figure in basis points. Frameworks change and inherited absolute thresholds silently start measuring something else.
- The dispersion of daily prints. In an ample system the spread is not just low, it is boring. Rising variance with an unchanged average is an early signal, and it is the one most likely to be dismissed as noise because the headline number has not moved.
- The behaviour of turn-of-period dates. Quarter ends stress funding for balance sheet reporting reasons that exist independently of reserve scarcity, which is why they are usually filtered out. Do not filter them. Track two things about them instead, which are how large the spike is and how many sessions it takes to decay. Both grow as the system tightens, and they grow before ordinary sessions show anything at all.
Confirmation, when you want it, comes from usage of the standing lending facility. Institutions borrowing reserves from the central bank at a penalty-adjacent rate is a revealed preference, and a rising pattern of that usage on non-quarter-end dates is about as unambiguous as this evidence gets.
Pre-committing the response, because the decision window is short
Funding stress compresses decision time to a degree that is hard to appreciate until you have sat through one. Write the ladder now, when nothing is happening.
At stage one, dispersion rising with the average unchanged, nothing in the portfolio moves. What changes is reporting. The spread and its turn-of-period behaviour go into the weekly risk pack, with the plot of spread against reserve level attached so the committee can see where on the curve the system sits.
At stage two, ordinary sessions printing above the administered rate persistently rather than at turns, the changes are operational rather than directional. Extend the maturity of your own funding, confirm counterparty capacity before you need it rather than during, and review collateral eligibility. These are cheap when the market is calm and expensive when it is not, which is the entire argument for doing them at stage two rather than stage three.
At stage three, spikes that fail to decay within a normal number of sessions, positions that depend on continuous access to repo funding get reduced. Not because a repo event is certain, but because the cost of carrying that dependence has risen and the market is no longer pricing it as free.
Write down at each stage what you will tell the committee, in advance. The reason is that stage two actions look like unnecessary caution to anyone who is not watching the spread, and the argument for them is far easier to make from a document written in a quiet week than from a chair in a room where something is going wrong.
The ways this detector will mislead you
It has two failure modes and they pull in opposite directions.
The first is false positives from collateral. Repo is a secured market, and its rate responds to the supply of collateral as well as to the availability of cash. A heavy settlement date that floods the market with bills can push the spread up for reasons that have nothing to do with reserve scarcity. Any single-day move needs a look at what settled before it becomes evidence of anything.
The second is the more expensive error, which is requiring too much confirmation. The whole point of watching a price rather than a quantity is that it moves early. A desk that waits for an unambiguous, sustained, multi-week widening before acting has converted an early indicator back into a coincident one and given up the reason for monitoring it at all. That is why the ladder starts with a stage where the only action is to look more carefully.