The setup that gets people into trouble is not a bad chart. It is a good one that has stopped working. Usage is climbing, the on-chain readings are strong, the network by every measure is busier than it was, and the price has gone sideways for two months. The instinctive read is that the market has not noticed yet and you have. That read is available. It is also the least likely of the three explanations, and taking it without checking the other two is how people end up holding the bag on a token that was doing fine operationally the whole way down.
There are three honest explanations for usage up and price flat. Someone is selling into the strength. The usage was bought rather than earned. Or accumulation is happening quietly ahead of a repricing. Each has a specific check, and the checks are cheap.
The score is a composite, so start by opening it up
Before you interpret a divergence you need to know what is on the other side of it, and a composite score will hide that from you by design. The On-Chain tab of the altcoin scorecard leads with an On-Chain Health Score of 84, labelled Very Strong, described as being based on hash rate, active addresses, transaction volume and miner revenue trends. Underneath are four bars. Hash Rate reads 100, Tx Volume 100, Miner Rev. 100, and Active Addr. 36.
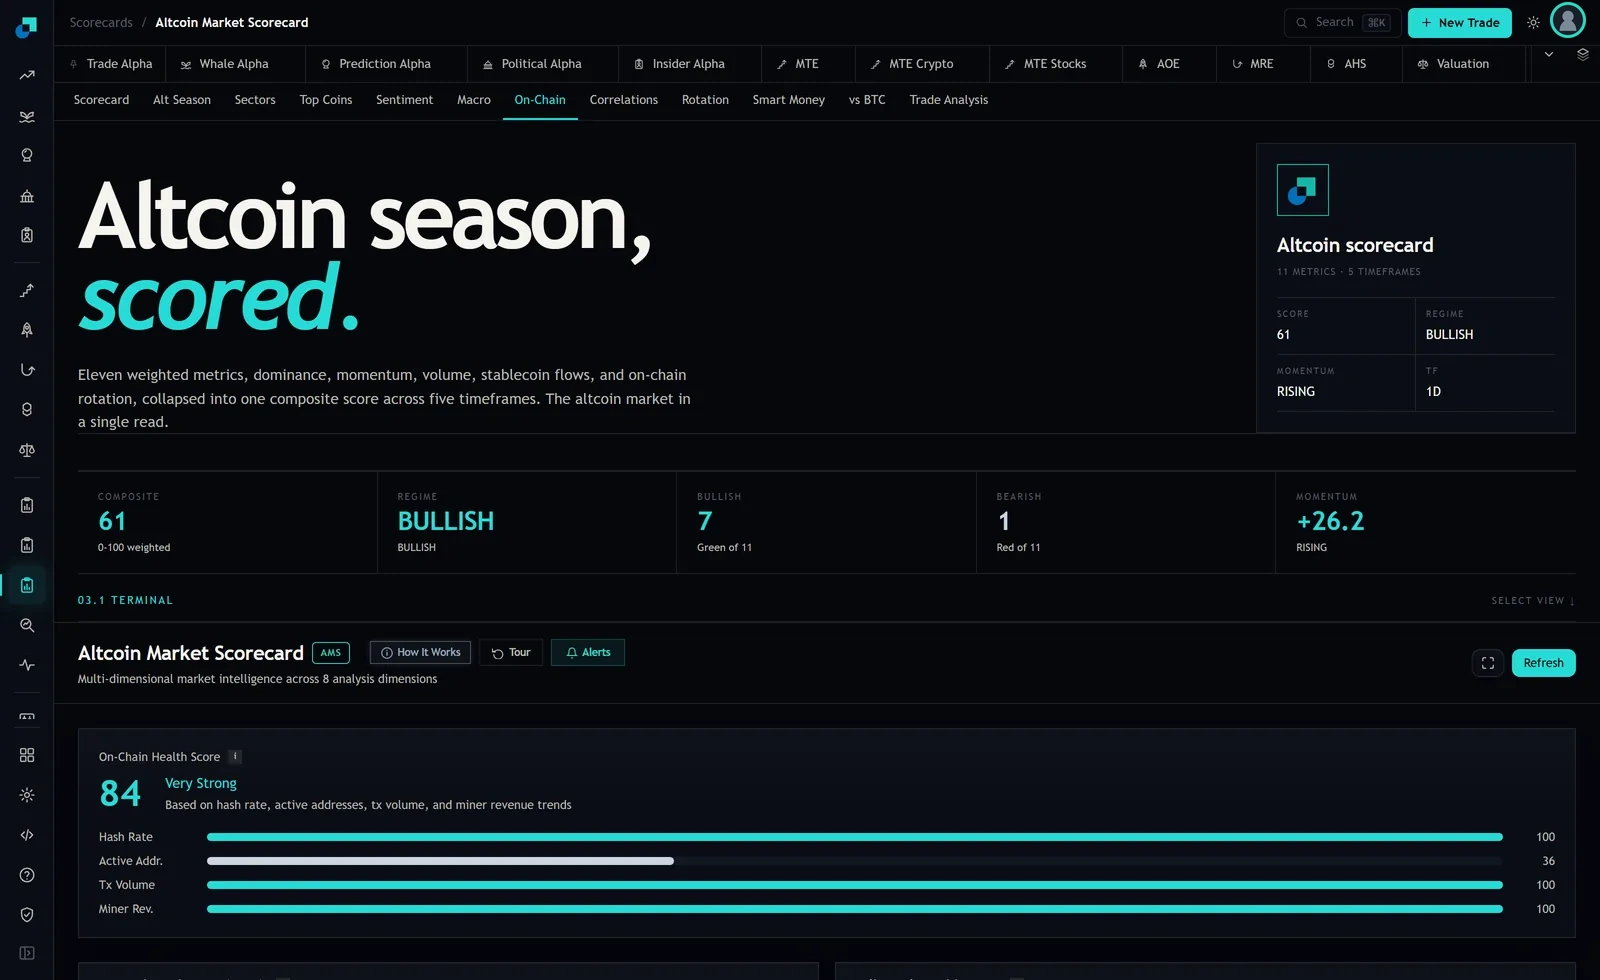
That matters for the divergence question. If three of four inputs are already at the top of their scale, then a rising composite is being driven by whatever is left, and the honest statement is not "on-chain activity is rising" but "one input moved". Do that decomposition first, every time, because a divergence between price and a composite is often a divergence between price and one narrow series that happens to be weighted heavily.
The wider module is worth glancing at for context too. The headline scorecard on this capture reads a composite of 61 with a Bullish regime, 7 of 11 metrics green and 1 red. A network health score of 84 sitting above a market composite of 61 is itself a divergence, and it is telling you that network conditions and market conditions are not the same thing.
Explanation one, someone is selling into it
The most common cause of good fundamentals and a flat price is supply. A token with an ongoing unlock schedule is delivering new sellers on a calendar, and a project that is genuinely growing is exactly the sort of project where team and investor allocations are large. Usage rises, the float rises faster, and price is the quotient.
The check takes ten minutes. Find the token's unlock schedule and write down two numbers. The percentage of current circulating supply that unlocks in the next ninety days, and the same figure for the ninety days after that. If the first number is above roughly 10 percent of float, you have your explanation and you do not need to look further. Sideways price with strong usage during a heavy unlock window is not a market failing to notice. It is a market absorbing supply, which is what a functioning market does.
The follow-up that actually pays is calendar work rather than analysis. Note the date the heavy tranche ends. The interesting moment is not now, it is the first month where usage is still climbing and the supply overhang has gone.
Explanation two, the usage was bought
The second explanation is that the activity is real in the sense that the transactions happened, and unreal in the sense that nobody would have done them unpaid. Incentive programmes, points campaigns, airdrop farming and fee rebates all produce genuine on-chain activity from users whose entire economic relationship with the protocol is the incentive.
Two checks separate paid activity from earned activity. First, look at activity per address rather than total activity. Farmed growth tends to show as many addresses each doing a small, repetitive, suspiciously similar amount. Organic growth shows a wider distribution. Second, and more decisive, find out whether a campaign is running and when it ends. If a programme is live, you have not learned anything about demand yet. If one ended recently and activity held, that is the single most informative data point available on this question, because it is the only one where the subsidy was removed and the users stayed.
This is also where the pinned bars come back. Transaction volume at the top of its range is compatible with both stories, so it cannot arbitrate. Active addresses, the one component here with room to move, is the more useful series for this specific question, which is a nice example of the least impressive number on a panel being the most decision-relevant one.
Explanation three, and why it is the residual
Quiet accumulation ahead of a repricing does happen. Patient buyers do work orders slowly to avoid moving the price, and price can genuinely sit still while ownership changes hands. The reason this belongs third rather than first is not that it is rare. It is that it is unfalsifiable from the outside, and unfalsifiable explanations are the ones that feel best and cost the most.
Treat it as a residual. You are entitled to the accumulation reading only after the unlock check comes back clean and the incentive check comes back clean. If you reach for it first, you will find supporting evidence, because you can always find supporting evidence for a story that makes no specific prediction.
What would move it from residual to positive evidence is a change in who holds the token rather than how much is being used. Growth in the count of mid-sized holders, rather than in the count of tiny ones, is the shape that goes with real accumulation. Exchange balances of the token falling while usage rises is a second one. Neither is proof, and both are more than the divergence alone gives you.
What to do while the question is open
The practical answer for a retail position is that a divergence is a reason to start work, not a reason to size up. Until the unlock and incentive checks are done, the divergence is uninformative, and an uninformative signal deserves a starter position at most.
Set a date to revisit rather than watching it daily. The checks that matter resolve on schedules measured in months, unlock cliffs and campaign end dates, so a weekly re-read of the same score tells you nothing new and slowly convinces you that you have been researching. Write down which of the three explanations you concluded and what would change your mind, then look again when the calendar item you identified actually arrives. If you cannot name the calendar item, you have not finished the work.