Any ranking you put in front of an investment committee inherits its credibility from its universe, not from its scoring. A committee can argue about whether relative strength works. What it cannot do is evaluate a top decile without knowing what the decile is a decile of. On the Asset Outperformer Engine that question has an unusually visible answer, because the board publishes three different population figures on the same screen and they are three different populations.
Three numbers that do not reconcile on their own
The universe tile in the header reads 19,171, subtitled crypto, stocks, etfs and macro. The FAQ, two scrolls down, says the engine runs a full scan every six hours and that each scan processes over three thousand assets across all supported asset types. The hero line says 555 assets versus the basket. Directly under it, a counter reads 100 of 555 assets outperforming the benchmark basket.
None of those is wrong and none of them means what the one above it means. Read as a funnel they are roughly: a reference set of nineteen thousand instruments, a scan population of a few thousand, a scored and displayed set of five hundred and fifty-five, and a currently-outperforming subset of one hundred. Four stages, three of which are stated as round or approximate numbers, and the transitions between them are the part your diligence needs to pin down.
The published category list gives a partial reconciliation of the middle stage. Crypto is described as 3,000 plus tokens by market cap, stocks as 400 plus US equities covering the S&P 500, NASDAQ 100 and sector leaders, ETFs and index funds as 130 plus, precious metals as four named metals, commodities as seven named contracts, and mutual funds as 20 plus. Add those and you land near three and a half thousand, which is consistent with the per-scan figure and nowhere near nineteen thousand. So the universe tile is counting something broader than what any single scan scores, and that is the first thing to ask about.
Where the drop happens between scanned and scored
The most instructive evidence is not in the tiles. It is further down the table, in the rows that are present but empty. On the All Assets capture, the bottom of the visible list holds names such as Orion Energy Systems, Personalis, Snowflake, Appian, NovaGold, IOTA, Horizen and OKB, each with a score of zero and dashes where price and market cap should be. These are not assets the engine rejected. They are assets it admitted to the table and then failed to populate.
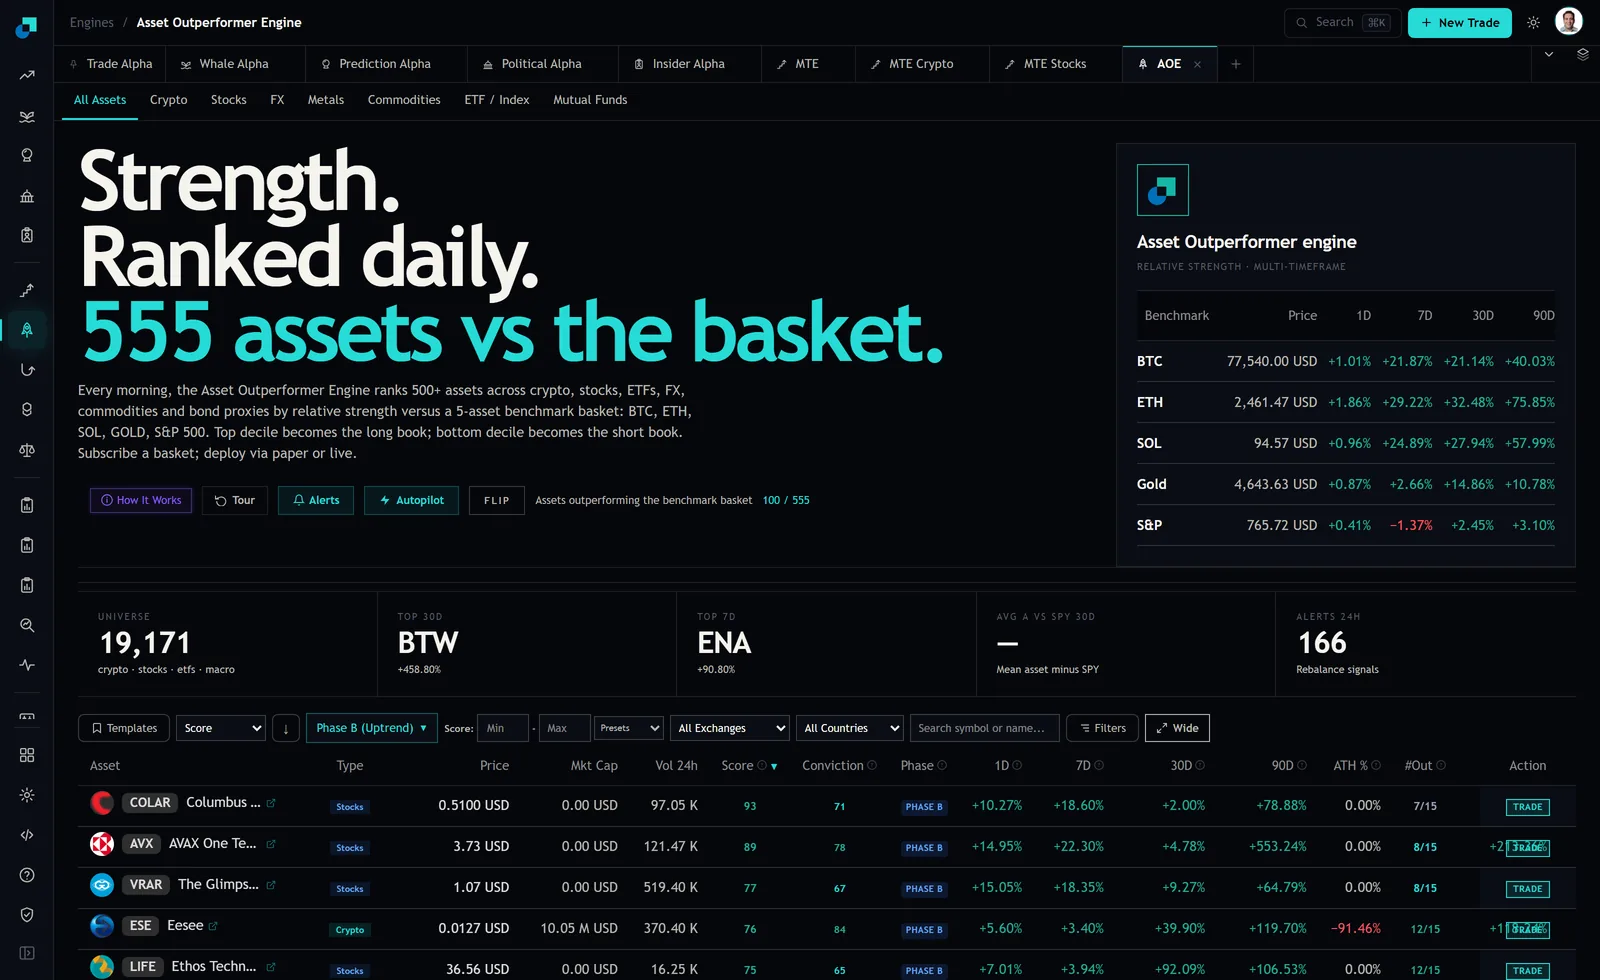
The diagnostic that matters is what happens to those same tickers one tab across. OKB scores zero with no price on the All Assets view and scores 70 with a price of 113.30 dollars, a 2.38 billion dollar market cap and a 30-day move of +37.90 percent on the Crypto tab. Orion Energy Systems and Personalis both score zero on All Assets and both score in the seventies on the US Stocks tab. That is not a coverage gap in the data pipeline. It is a display or pagination behaviour of the aggregate view, and it means an analyst who works only from the All Assets tab will systematically conclude that covered assets are uncovered.
Write that down, because it is the kind of finding that changes how a team uses a tool rather than whether they buy it. The instruction to the desk is that per-type tabs are authoritative for coverage questions and the aggregate tab is not.
The exclusions made before the list reaches you
Two exclusions on this board are made upstream of anything you do, and both are documented rather than inferred.
The first is the classifier. The FAQ states that the engine includes a machine learning asset classifier that identifies meme coins and stablecoins, that both are excluded from results by default, and that the exclusion can be toggled in the advanced filters panel. For a relative strength ranking, excluding stablecoins is close to structurally necessary and excluding memes is a judgement call. Either way, it is a universe decision made by a model whose features, training data and error rate are not disclosed on the screen. In a signal definition document, that belongs in the same section as your own screens, described as a vendor-side classifier you do not control.
The second is the phase filter. On the capture, the dropdown above the table reads Phase B (Uptrend), and every visible row in the table shows PHASE B in the phase column. The rows all agreeing is a consequence of the filter, not a property of the market. The 555 count in the hero and the list underneath are therefore not the same object, and any breadth statistic you compute from what is on screen inherits that filter. This is the single easiest way to produce an accidentally overstated breadth reading from this module.
Two more things sit on my list of unknowns rather than my list of findings. The board gives no visible minimum history requirement, so I cannot tell you how many days of price an asset needs before it can score. It gives no visible liquidity floor either, and the top of the ranking argues strongly that any such floor is loose: Columbus Acquisition Corp ranks first at a score of 93 with 24-hour volume reading 97.05 K, and Ethos Technologies scores 75 with volume reading 16.25 K. Those are not institutional sizes. If a liquidity screen exists, it is not one that would satisfy a desk, and your own floor has to go on top.
Auditing the names that never appear
The reviewer's job is to turn absence into a documented list, and the procedure is mechanical. Take the current holdings and watchlist, and for every symbol use the search field on the correct type tab. Each name resolves into one of three buckets. It returns a scored row, in which case it is covered. It returns a row with a score of zero and empty price and market cap cells, in which case it is admitted but not populated and you note the tab you were on. Or it returns nothing at all, in which case it is outside the scan population and the ranking will never have an opinion about it.
That third bucket is the one that gets missed, and it is the one with real consequences. A ranked rotation that can only ever select from names the engine scores has an implicit exclusion for everything in bucket three, and if your existing book is concentrated in instruments that live there, the overlay will look like it is telling you to rotate out of your entire portfolio when it is actually telling you it cannot see it.
Do the same exercise on classification. The type column carries values including us_stocks, crypto, etf_index and international_stocks, and on the capture several plainly non-US listings, including Medivir AB and Active Biotech AB, carry the us_stocks type. Separately, Active Biotech shows a 30-day move of +9,122.97 percent, which no reasonable reading treats as a price return. Neither of those invalidates the ranking. Both mean the type label is not reliable enough to drive an exposure constraint, and that a sanity band on reported returns belongs in your ingestion layer rather than in your trust.
The questions that belong in the diligence file
Five questions, in the order I would ask them. What exactly does the 19,171 universe figure count, and is it instruments, listings or symbols across venues. What are the necessary conditions for a row to receive a non-zero score, stated as a rule rather than an example. Whether the outperforming counter is capped, because it reads exactly 100 of 555 on the All Assets tab and exactly 100 of 171 on the Crypto tab, and two identical numerators across very different denominators is either a coincidence or a display limit that would quietly break any breadth series built from it.
Then the two that decide whether a backtest of this thing is worth reading. Whether delisted, deprecated and dead assets remain in the historical scan population or drop out of it, because a ranking rebuilt only from survivors will look considerably better than it was. And whether the classifier and the category coverage figures have been stable over the history you intend to test, because a universe that grew from four hundred names to three thousand halfway through the sample is a different strategy at each end of it.