A sector-tilted sleeve has one parameter that gets set by habit more often than by evidence, and it is the rebalance interval. Monthly, because that is what the equity book does. Weekly, because crypto feels faster. Neither number has any relationship to how long a sector's leadership actually lasts, and since the cost of the sleeve is close to linear in that interval while the benefit is not, getting it wrong is expensive in a way that does not show up as a bad call.
The parameter you want is the persistence half-life of sector leadership: the horizon over which a bucket's rank in the cross section decays toward random. Everything downstream, rebalance frequency, turnover budget, the capacity of the sleeve, follows from it.
What one panel can and cannot tell you about persistence
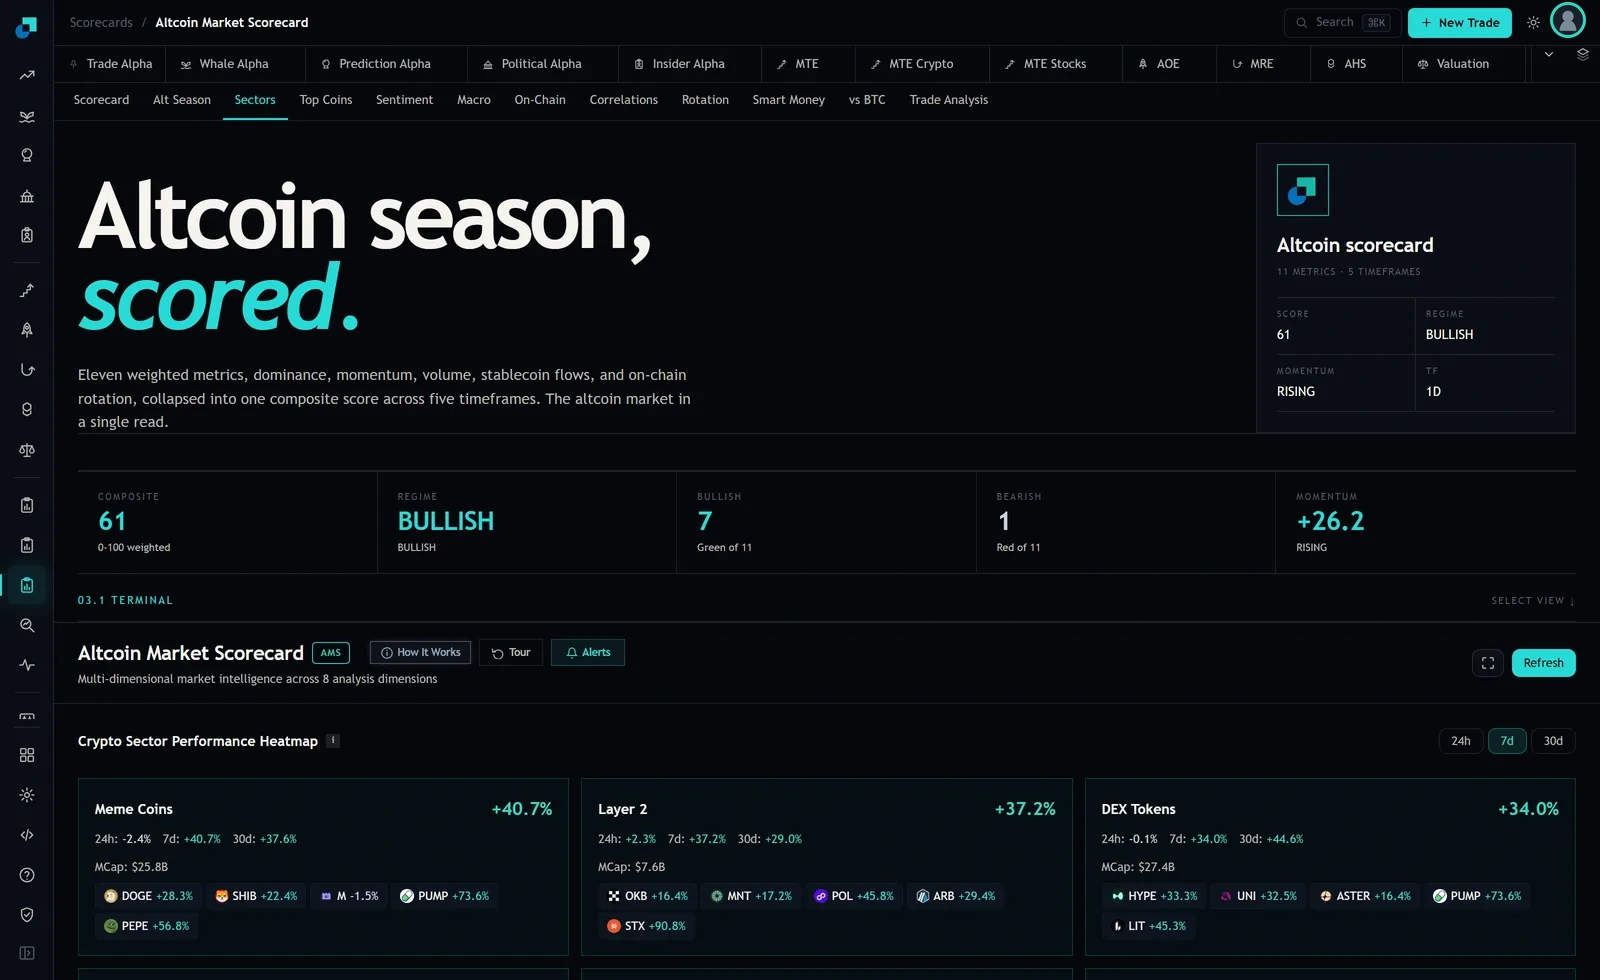
Start with the honest limit. The sector heatmap shows each bucket over three windows, 24h, 7d and 30d, captured on one day. Three overlapping trailing windows read on a single date is not a time series. You cannot fit a decay to it, and any half-life quoted from it would be invented.
What it does give you is a shape check, and a reason to take the question seriously. It also gives you the schema you would have to capture repeatedly to answer the question properly, which is the useful part.
The rank instability that is visible on one screen
Take the three buckets on screen at capture and rank them at each window. Over 30d: DEX Tokens +44.6 percent, Meme Coins +37.6 percent, Layer 2 +29.0 percent. Over 7d: Meme Coins +40.7 percent, Layer 2 +37.2 percent, DEX Tokens +34.0 percent. Over 24h: Layer 2 +2.3 percent, DEX Tokens minus 0.1 percent, Meme Coins minus 2.4 percent.
The leader changes at every window, and the 30d leader is last over 7d while the 7d leader is last over 24h. The rank correlation between the 30d and 7d orderings, and again between the 7d and 24h orderings, comes out negative on this snapshot. With three buckets on one day that statistic means nothing on its own and I would not put it in a note. What it does justify is refusing to assume the opposite, which is what a slow rebalance cadence quietly assumes.
The measurement that gives you a half-life
To get the parameter you have to build the series yourself, and the specification matters more than the statistics.
Snapshot the full sector table at a fixed time each day and store it point-in-time, with the taxonomy version attached to every row. That last field is not optional. Sector definitions in crypto get revised, and a persistence study run on a restated taxonomy measures the classifier's hindsight rather than the market's memory, which will make leadership look far more persistent than it was.
Then compute the cross-sectional rank of each bucket at each date on a non-overlapping window, and take the rank correlation between date t and date t plus lag, across the whole history, for a series of lags. Plot the correlation against lag. It will start near one and decay. The lag at which it reaches half its initial level is your half-life. Fit an exponential if you want a single number, but look at the plot first, because leadership decay in crypto is frequently not smooth and a fitted constant can hide a step.
Three traps. Use non-overlapping windows for the return input, because overlapping trailing windows share observations and manufacture autocorrelation that is an artefact of the construction. Include dead buckets and dead members, otherwise survivorship inflates persistence. And run the study separately on the top of the cross section, since leadership persistence and laggard persistence are different questions and only one of them is what your sleeve is trading.
Turning a half-life into a rebalance interval and a turnover budget
Once you have a half-life H, the interval T follows from a simple tradeoff. The fraction of the original signal still present after interval T falls roughly as one half raised to the power T over H. Rebalancing much faster than H mostly re-trades positions whose ranks have not changed, so you pay full cost for a small change in holdings. Rebalancing much slower than H means the sleeve spends most of each period holding last season's leaders. Neither extreme is subtle, and both are common.
Then cost it. Annual cost in basis points is approximately the number of rebalances per year multiplied by the average two-way turnover per rebalance multiplied by the round-trip cost per unit traded. Put illustrative numbers in to see the shape. At 25 percent turnover per rebalance and a 60 basis point round trip, monthly rebalancing costs about 180 basis points a year and weekly rebalancing costs about 780. Those inputs are assumptions, not measurements, and yours will differ, particularly the round-trip figure, which for smaller sector members should come from your own fills rather than from quoted spreads.
The comparison that decides the cadence is that annual cost against the expected gross spread the tilt captures at that cadence. If the half-life is long relative to the interval you are considering, the faster cadence buys you very little extra signal and costs you the full increment, so the slower one wins on arithmetic alone. The turnover budget is then simply the cost number you are willing to spend expressed as a limit, and it should be a hard limit in the sleeve's policy rather than a soft expectation, because turnover in a discretionary overlay drifts upward without anyone deciding that it should.
The interim policy before the measurement exists
Most desks reading this do not have the persistence study and will not have it next week. That is not a reason to leave the cadence at whatever it currently is, and there are three things worth doing immediately.
Pick the slowest cadence the mandate permits and treat it as the default until evidence supports something faster. The asymmetry favours it: the cost of trading too slowly is opportunity, which is invisible and bounded, while the cost of trading too quickly is realised and compounds every period.
Separate the tilt from the rebalance. A sleeve that trades on a fixed calendar regardless of whether ranks changed is spending money on the calendar. Add a no-trade band on rank, so a bucket that has not moved position does not generate a ticket, and log how often the band binds, because that frequency is itself a crude first estimate of persistence that you will get for free.
Finally, start the snapshot now, even if nobody analyses it for a year. The panel is a display and displays are not archives. A daily point-in-time capture with the taxonomy version attached costs almost nothing today and is the only thing that will let you answer the cadence question with a measurement rather than with a preference when the investment committee eventually asks where the monthly rebalance came from.