Before you look at a single performance number on a momentum library, compute the arithmetic that constrains it. A sleeve's gross return has to cover its own trading before any of it belongs to the fund, and the size of that bill is fixed by two inputs you can estimate in an afternoon. Round trips per year, multiplied by all-in cost per round trip, equals the gross return required to break even on execution alone.
It is a trivial identity and it is routinely skipped, because turnover feels like an implementation detail and costs feel like something the ops team handles. On a high frequency sleeve neither is true. The hurdle can exceed the entire gross edge, and when it does, no amount of signal quality rescues it.
Pricing one round trip, in four parts
All-in cost per round trip is not the commission line. Build it from four components and keep them separate, because they respond to different interventions.
- Commission, both legs, at your negotiated schedule for that instrument class. A library spanning crypto spot and futures, US equities, forex and commodities pays on four different schedules and a blended figure will conceal the one that is bleeding.
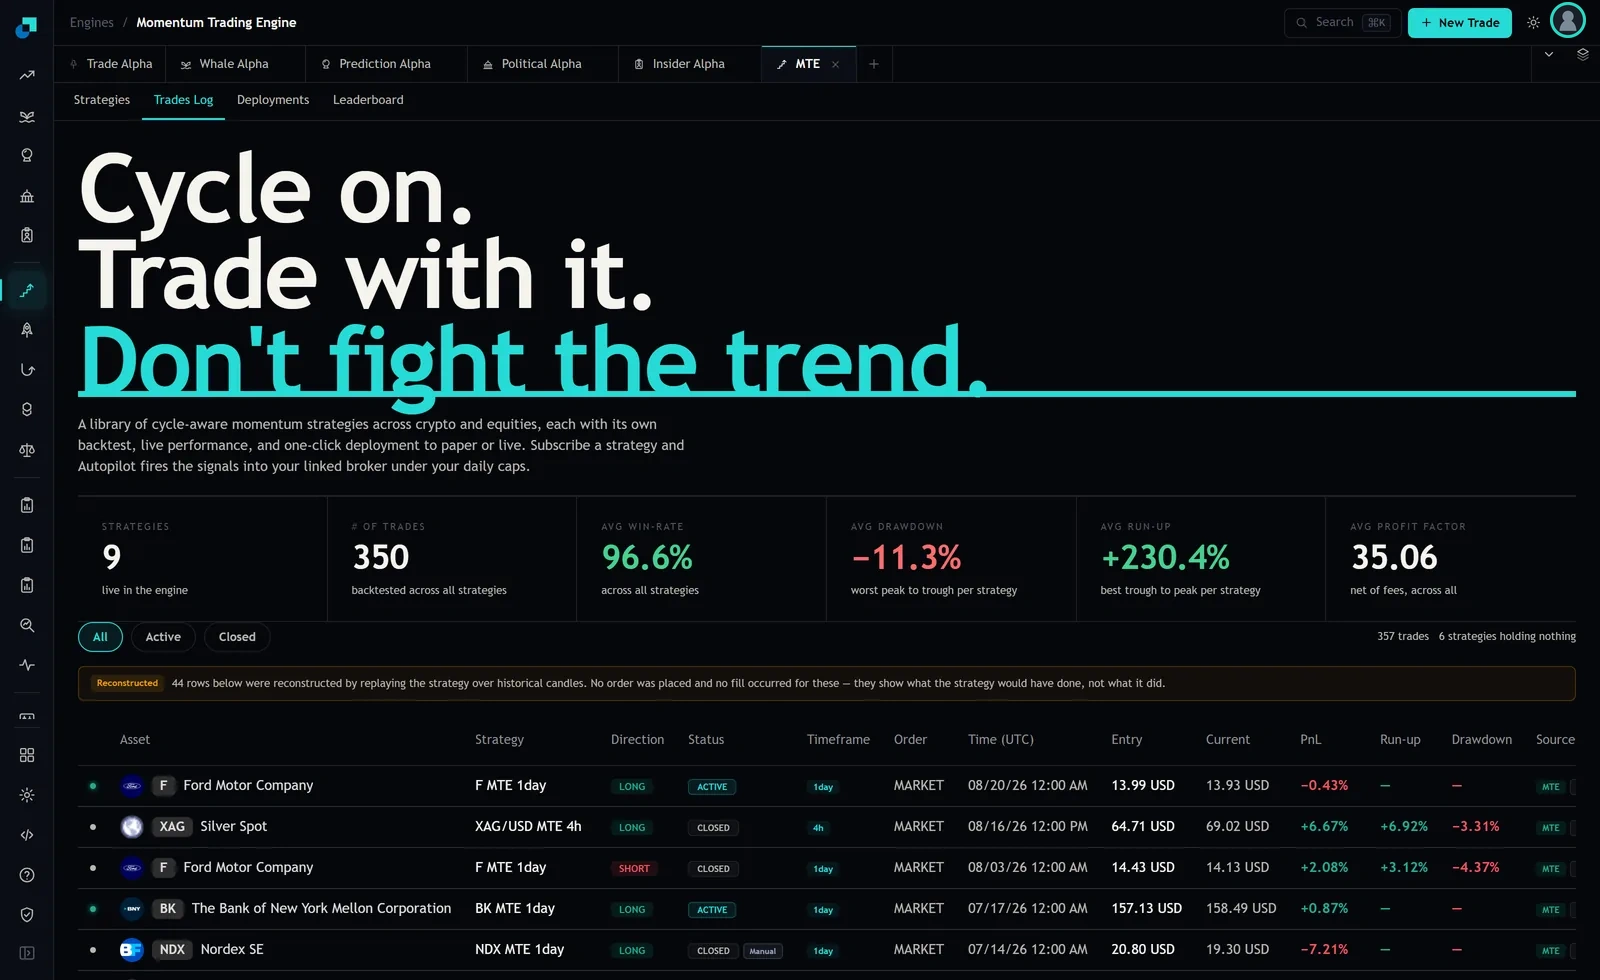
- Spread, at twice the half spread if you are crossing. The trade log's Order column read MARKET on the active row at capture, so crossing is the working assumption until the strategy specification says otherwise.
- Impact, which is a function of your participation rate rather than a constant, and which is the component that makes the hurdle rise with allocated capital.
- Financing, which people forget entirely. One of the crypto configurations at capture carried Leverage 2 on a Solana perpetual, so funding accrues against twice the notional for the whole holding period. Short equity carries borrow. Futures carry roll.
Add them and you have C, in basis points, per completed round trip. For a liquid large cap at institutional commission rates and small participation, C in the teens is defensible. For a perpetual at leverage, a mid cap, or a participation rate above a few percent of volume, C in the forties or higher is realistic. The range matters more than the point estimate, which is why the next step is a table rather than a number.
The hurdle table, and where a signal library sits on it
Required gross return, in percent per year, purely to cover round trips:
| Round trips per year | C = 10 bps | C = 20 bps | C = 40 bps | C = 60 bps |
|---|---|---|---|---|
| 50 | 5 | 10 | 20 | 30 |
| 100 | 10 | 20 | 40 | 60 |
| 200 | 20 | 40 | 80 | 120 |
| 400 | 40 | 80 | 160 | 240 |
Read the bottom right corner and then read it again. A sleeve turning over four hundred round trips a year at sixty basis points a round trip has to produce 240 percent gross before the investor sees anything. That is not a sleeve, it is a fee generator with a signal attached. The interesting territory is the top left, and the practical question about any candidate strategy is which cell it lands in.
Reading cadence off the log, and the input the capture will not give you
Trade count is observable. The trades tab showed 357 trades at capture, with an explicit banner stating that 44 of the rows below had been reconstructed by replaying the strategy over historical candles, that no order was placed and no fill occurred for those rows, and that they show what the strategy would have done rather than what it did. That leaves 313 rows that correspond to something that actually happened, which is the number to work from.
The signal feeds give you a second read on cadence. The crypto feed showed 50 of 442 items and the equity feed 50 of 114. The cards come in pairs, an entry that takes the position from flat to long and an exit that takes it back to flat, which is visible directly in the two Curve cards at capture. On that basis 442 crypto cards is on the order of 220 round trips and 114 equity cards is on the order of 57, across every configuration in each feed.
Now the input the capture does not contain. Nothing on those surfaces states the window. Turnover is a rate, and a count without a period is not a rate. Two hundred and twenty round trips over five years is a slow book. The same count over four months is a fast one, and the two land in different rows of the table. Get the backtest start and end dates in writing, per strategy, before you put any number in a memo. The one dating clue available is unhelpful in an instructive way, since the crypto cards at capture ran to August 2026 while the equity cards ran to November 2025, so the two feeds were not covering the same window at all.
Where the hurdle bites, in a ten hour round trip
The cost of a round trip is fixed in basis points and the gross edge of a trade is not, which means the hurdle is brutal at short holding periods and almost invisible at long ones. Work a real pair from the feed.
CONFIGURATION 20 bought Curve at 0.2266 and sold at 0.2289, on a 360m timeframe, with the entry and exit stamps about ten hours apart. Gross, that is a move of 101 basis points. At C of 20 basis points the trade nets 81. At C of 40 it nets 61. At C of 60 it nets 41. Your cost assumption, which is a number nobody in the investment committee will challenge, determines 60 percent of the outcome of that trade.
Now put it the other way round, because this is the version that belongs in the risk report. Express C as a fraction of average gross profit and loss per trade. On a 101 basis point gross trade, a 40 basis point cost is a cost ratio of 40 percent. A sleeve running a cost ratio near a half is one fee change, one spread regime, or one liquidity event away from having no edge at all, and it will get there without the signal deteriorating by a single basis point. I treat anything above thirty percent as a size constraint rather than a monitoring item.
The corollary is that the same signal on a longer timeframe has a completely different economic profile. If the rules produce a comparable gross move over three weeks instead of ten hours, the cost ratio collapses and the strategy becomes viable at sizes where the fast version never was. That trade off, edge per unit time against cost per round trip, is the actual decision when you select timeframes from a library that offers several of them on the same instrument.
What the headline tiles exclude, and what to write in the mandate
The engine's header carries an average profit factor of 35.06 described as net of fees, across all. Treat that phrase as a claim without a basis until someone tells you which fee schedule, which venue, and which side of the spread. Net of fees is not net of costs. It says nothing about the spread you cross, the impact you cause at your size, the funding you pay on a levered perpetual, the borrow on a short, or the tax the vehicle incurs. It also sits above a trade count that includes the reconstructed rows, which by construction paid nothing at all.
The same applies to a best return of 430 percent and an average Sharpe of 1.58 on that header. A return figure quoted without the turnover that produced it is not comparable to anything, because two sleeves with identical gross returns and different cadences are different products.
So make the two inputs explicit where they can be enforced. Write the assumed round trips per year and the assumed all-in cost per round trip into the sleeve's mandate, both as point estimates and as the breach level. Reconcile realised cost against the assumption monthly, per instrument, from broker files rather than from the vendor's log, which carries no commission field. And when realised C comes in materially above assumption, resize the sleeve rather than reopening the argument about whether the signal still works. The signal is not the thing that changed.