Most desks compress the volatility term structure into a single scalar. Front above back means stress, back above front means calm, and the sign gets copied into the morning note next to a risk-on or risk-off word. That reading throws away the only part of the curve that is directly tradeable. A term structure sloping smoothly in either direction is describing the general level of demand for optionality. A term structure with a bump in it, one expiry quoted meaningfully above the expiries on both sides, is naming a date.
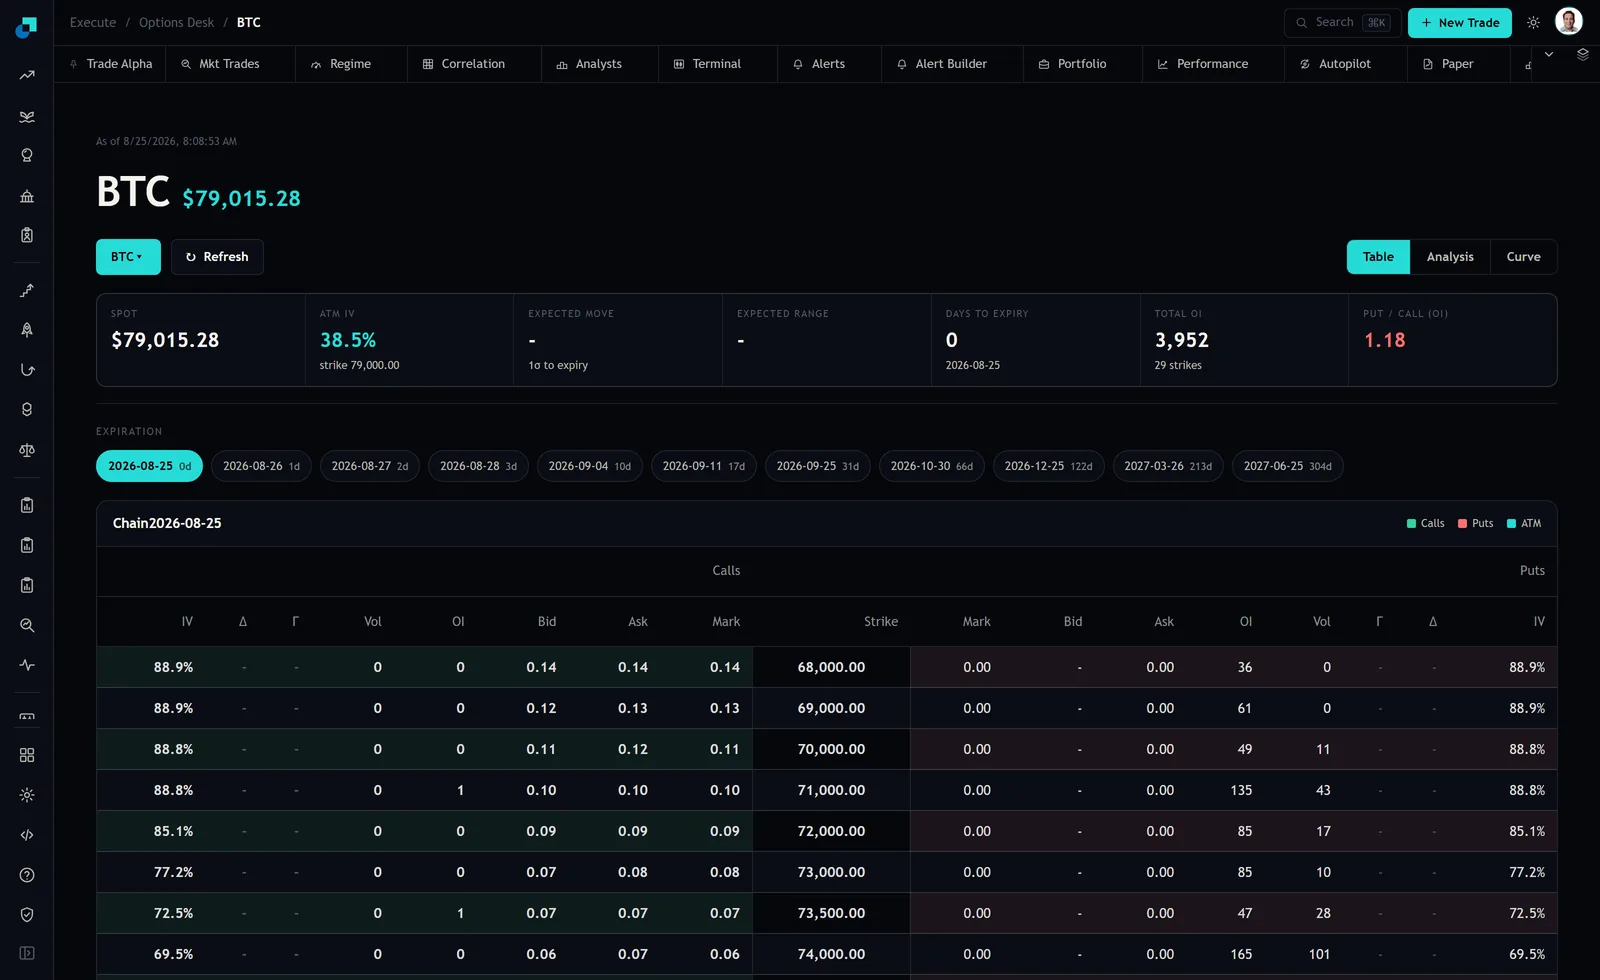
I read the BTC chain on the Blockcircle Options Desk at 8:08 on 25 August 2026. Spot was 79,015.28, at-the-money implied volatility on the front expiry printed 38.5 percent against the 79,000 strike, total open interest on that expiry was 3,952 contracts across 29 strikes, and the put/call ratio on open interest was 1.18. The ATM number is the headline. The expiry ladder underneath it is what I actually work with, because the curve is assembled from those points and the shape between them is where an event either is or is not being priced.
A kink is a statement about forward variance
Variance is additive in time and volatility is not, which is why eyeballing the quoted vols in a row misleads. The honest way to read two adjacent expiries is to strip out the overlap and look at what the market is charging for the window between them.
Take two points off the ladder as an illustration, the 17-day expiry dated 2026-09-11 and the 31-day expiry dated 2026-09-25. Suppose the 17-day quotes 40 percent and the 31-day quotes 44 percent. Total variance to the near date is 0.40 squared times 17/365, which is 0.00745. To the far date it is 0.44 squared times 31/365, or 0.01644. The difference, 0.00899, is the variance the market is assigning to the 14 days between the two expiries. Annualise it by dividing by 14/365 and take the square root and you get roughly 48.4 percent.
So a four-point difference in the quoted numbers is an eight-and-a-half point premium on the forward window. That is the number to argue about in a meeting, not the 44. Run the same arithmetic across every adjacent pair on the ladder and the curve stops being a shape and becomes a series of dated prices, each one covering a specific stretch of calendar. When one of those forward numbers stands well clear of its neighbours, the market has an opinion about something happening in that window.
The ladder is coarser than the calendar you care about
The second thing the arithmetic exposes is resolution. The expirations available on the chain that morning ran 0, 1, 2, 3, 10, 17, 31, 66, 122, 213 and 304 days out. The front week is dense enough to isolate a single session. After 31 days the granularity collapses. The gap from 31 to 66 days is 35 calendar days wide, the next is 56 days, and the one after that is 91.
That matters for how you write up a signal. A forward vol computed between the 31-day and 66-day expiries is a claim about 35 days of calendar, not about a date. If your thesis is that a specific scheduled event in mid October is being underpriced, the chain cannot confirm or deny it at that tenor, and any note that says otherwise is reading precision that does not exist in the quotes. The honest formulation is that the window containing the event is bid, and that you cannot separate the event from everything else in the window without a finer expiry or a second instrument.
Three ways a bump turns out to be nothing
The first is thin open interest. Total OI of 3,952 contracts spread over 29 strikes averages about 136 contracts per strike, and that is the front expiry, which is normally the busiest one on the board. Whatever your contract multiplier, the back months carry less. A vol point that comes off two or three quotes nobody has updated is not a market opinion, it is a screen artifact, and building a calendar around it means paying real spread to arbitrage a number that will not fill.
The second is the mechanics of the ATM point itself. The desk marks ATM against the 79,000 strike with spot at 79,015.28, which is a close fit. On a coarser strike grid further out the curve, the ATM vol is an interpolation, and a kink that appears only after interpolation across a wide strike gap is a property of your fitting method rather than of the market.
The third is the front-expiry null. On that morning the chain's front expiry had zero days to expiry, and the expected move and expected range tiles both rendered as a dash rather than a number. Anything downstream that consumes those fields mechanically gets a blank on precisely the expiry that a same-day catalyst would live in. If you run this into a systematic reader, handle the null explicitly rather than letting it propagate as a zero.
Expressing the view, and what it costs when the date is wrong
The natural expression is a calendar in the same strike region, long the expiry you think is cheap against short the one you think is rich, and the natural mistake is to treat it as a spread trade that cannot hurt you.
Long the near expiry and short the far one is short vega and long the near-dated gamma; it loses if the event window arrives and nothing happens, because you paid for a move that did not print, and the far leg you are short can reprice against you on any general vol expansion. The reverse structure, long the far expiry against short the near, is long vega and short near-dated gamma; a gap through the strike before the near leg expires produces a loss that is not bounded by the net debit you paid, and it is the leg that goes wrong fastest. Straight ownership of the humped expiry loses the entire premium if the catalyst resolves quietly, which is the single most common outcome for a scheduled and widely anticipated event.
There is also the specific failure this trade type carries. If the event moves, and dated catalysts move often, the vol that was sitting in your expiry drains into a different one. You are then wrong on both legs at once, and you find out on a day when the whole curve is falling, so the exit is offered at the worse side of both spreads. On a chain averaging 136 contracts per strike, crossing two bid-ask spreads to get in and two to get out is a material fraction of the edge you calculated, and it should be subtracted before the trade is approved, not discovered afterwards.
What goes in the file before the ticket
The bump is a hypothesis, and the discipline that makes it defensible in a review is writing down the falsification before the fill. I want six things recorded at trade time.
- The two expiries used, quoted as dates from the ladder rather than as day counts, because the day counts move and the dates do not.
- The forward vol between them, the level, and the arithmetic that produced it, so a reviewer can reproduce the number without me.
- The named catalyst, and the reason it falls inside that specific window rather than the one on either side.
- The level at which the forward vol is no longer attractive, set before entry, which is what stops a thesis about a date turning into a directional position on the asset.
- The capacity implied by open interest at the strikes involved, and what fraction of it the intended size represents.
- The unwind date, which for an event trade is normally the session after the catalyst regardless of the outcome, because the reason you owned the structure has expired even if the profit has not arrived.
The reason to write that down is not process theatre. A kink is one of the few readings on an options screen that carries a testable prediction with a date attached, which makes it one of the few you can honestly grade afterwards. Keep the log across twenty of them and you will learn whether your desk reads catalysts well or whether it has been paying up for calendar bumps that were mostly quote noise, and that is a question you cannot answer from a curve you looked at once.