The question that kills most whale following proposals at investment committee is not whether the signal works. It is what happens to the signal when you put real money behind it, and the honest answer is usually available before you run a single backtest. Capacity in a copy strategy is a multiplication of three numbers you can read off the platform in a few minutes, and the product is almost always smaller than the sponsor of the idea expects.
I would rather do that multiplication in week one than discover the ceiling in month nine, after the sleeve has been funded at three times its viable size and the attribution has gone quietly negative for reasons nobody can name.
Capacity is clip size times concurrency, and nothing else
Strip the strategy to its mechanics. You observe a tracked wallet taking a position. You take some fraction of that position, at your own venue, some interval later. You exit when it does, or on your own rule. Everything about capacity flows from two questions: how large can each of your clips be, and how many can be open at once.
Clip size is bounded by two constraints and you take the smaller. The first is participation against the whale itself, because the whale's own size is a proxy for how much the underlying can absorb without the trade becoming self defeating. The second is depth at your execution venue, which is frequently the binding one, because you are almost never trading in the same book the whale was in.
Concurrency is signals per period multiplied by average holding period, divided by the period. Forty independent signals a month at a five day average hold gives you roughly six and a half positions open at any moment. Capital deployed is clip times that concurrency, and everything else is cash drag.
Reading the clip constraint off the tracked cohort
At capture, the Whale Alpha Feed reported 12.5 million dollars of tracked whale volume across 50 transactions from 28 active wallets over twenty four hours. That puts the average tracked print at roughly 250,000 dollars.
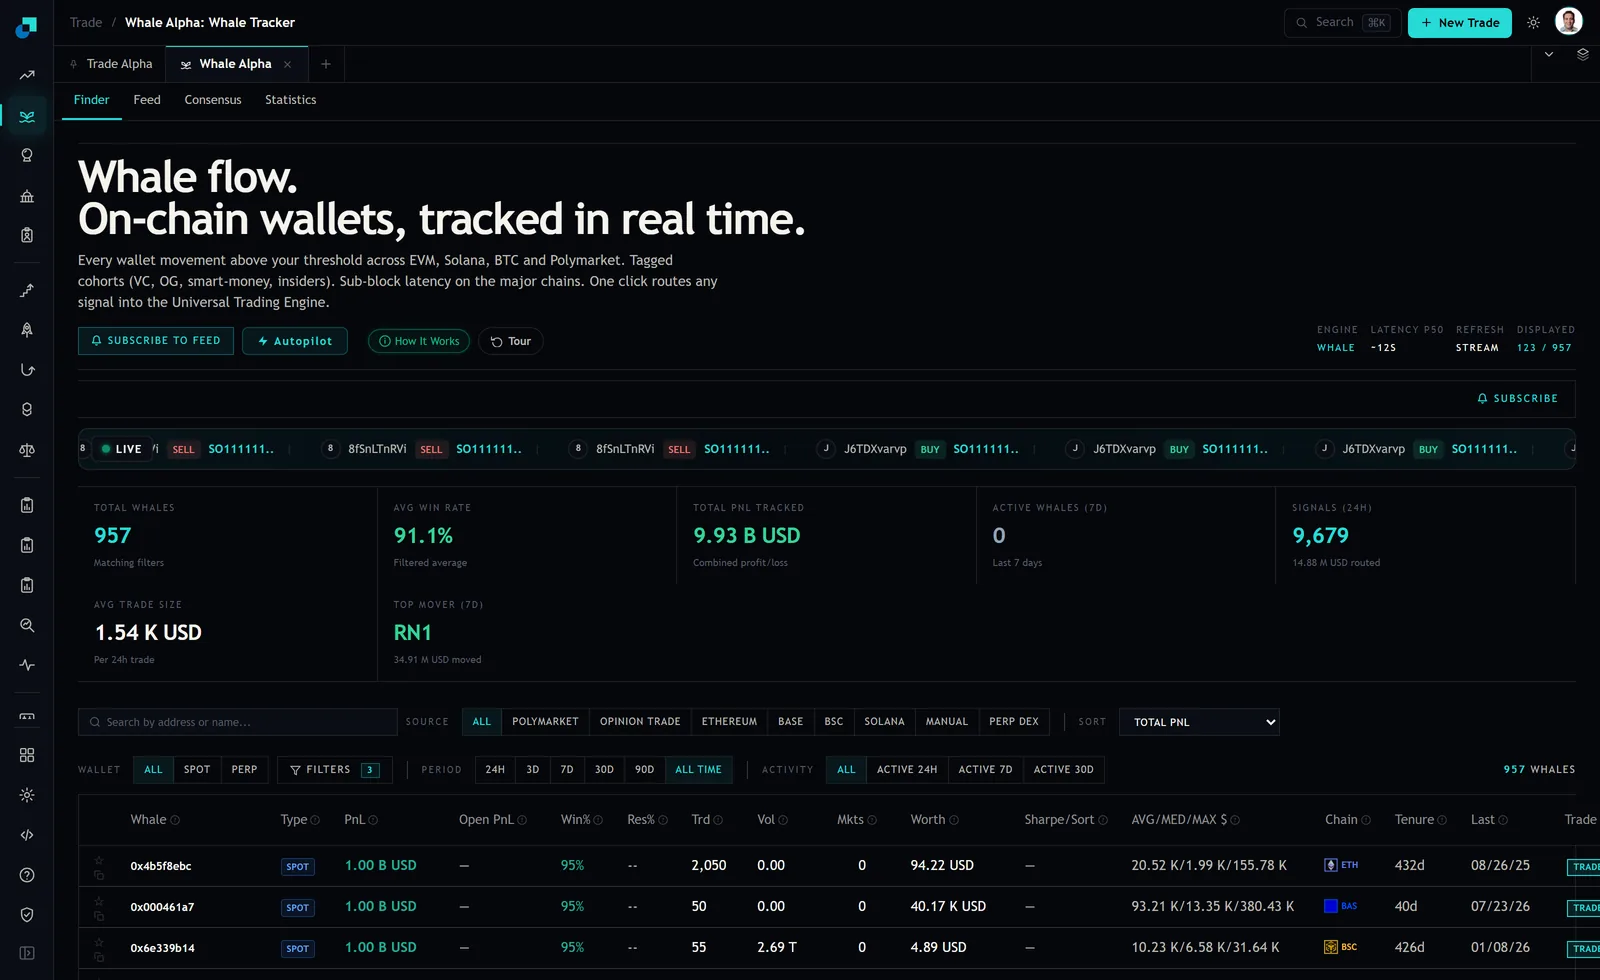
Take a 10 percent participation cap against the whale's notional, which is conservative but defensible in a committee setting because it keeps your order small relative to a trade the market already absorbed. Against a 250,000 dollar average print, that is a 25,000 dollar clip. Push participation to 25 percent and you are at roughly 62,500 dollars, at the cost of a materially worse slippage profile and a much harder story to tell if the position moves against you.
Now check the second constraint. The tracked venues include DEX perpetuals on Hyperliquid, GMX, Drift and dYdX, plus prediction market wallets on Polymarket and Opinion Trade. Depth in those books varies enormously by instrument, and for the prediction market leg it is often the harder ceiling, because a question with a few million dollars of total interest cannot take an institutional clip at anything resembling the screen price. Whichever number is smaller becomes your clip.
Turning clip into a sleeve number
Assume the 25,000 dollar clip and work forward. If your filtered wallet set generates 40 signals you would actually act on in a month, and the average holding period is five days, concurrency is about 6.7 positions. Deployed capital is roughly 167,000 dollars.
That is the number. It is not a typo and it is not pessimism. A sleeve running at that level of deployment cannot carry a research analyst, cannot move a fund level return, and cannot justify the operational overhead of custody, venue onboarding and reconciliation across four or five execution venues.
The levers to raise it are all visible and all have costs. Widen the wallet set and concurrency rises, but the marginal wallet is by construction worse than the ones you already picked. Extend the holding period and concurrency rises proportionally, but you are no longer following the whale, you are running your own exit rule with a whale entry, which is a different strategy and needs its own evidence. Raise participation and clip rises, but slippage grows non linearly and you begin to trade against the wallet you are copying. Only one of those three is free, and none of them are large.
The tile that read zero, and what it should teach you
The Statistics tab at capture displayed a tracked whale count of 26,687, an average win rate of 44.3 percent, a best performing wallet at a billion dollars, and an average bet size of zero dollars. That last tile is the useful one for this exercise, precisely because it was not populated.
If you had built your capacity model on a single platform level average bet size field, you would have built it on a zero, or worse, on a number computed across a scope you never verified. Any capacity estimate that a committee will defend has to be reconstructible from primitives, in this case volume and transaction count over a stated window, so that a reviewer can rebuild it and get the same answer. A derived tile is a convenience. It is not a source, and it should never be the only input to a number that sizes a mandate.
The same discipline applies to the denominator. The 26,687 figure is a census across every venue the platform indexes, including wallets that traded once and the wallet listed as the worst performer at zero. Your investable cohort is the filtered subset, closer in scale to the 123 rows displayed than to the census, and your signal count must come from that subset over an observed window rather than from the platform total.
Writing the ceiling into the mandate document
State three things explicitly and the strategy becomes reviewable rather than aspirational.
- The capacity ceiling in dollars, with the clip, signal count and holding period assumptions shown as separate lines so each can be challenged independently. A single number with no visible inputs will be argued about forever.
- The participation cap as a hard operational limit, not a guideline, expressed as a percentage of the observed whale notional. This is the line that stops a portfolio manager from quietly solving a deployment shortfall by sizing up.
- A slippage budget in basis points against the whale's fill, with an agreed measurement method. The roughly 12 second median observation latency is the optimistic floor on your delay, before your own decision time and your own venue's execution. Whatever number you assume, log the realised figure per trade from day one, because the gap between assumed and realised slippage is the single most common reason a copy sleeve underperforms its own backtest.
Run those three lines and the strategy usually resolves into one of two honest outcomes. Either it is a small, high conviction satellite whose sizing is capped by structure rather than by risk appetite, which is a perfectly respectable thing to own and to describe as such. Or it does not clear the operational hurdle at the size it can actually carry, in which case the right decision is to say so in week one rather than to discover it after the venue integrations are already built.