Every cross-venue prediction market pitch I have read starts from the spread and works outward. The deck shows a question priced at 42 on one venue and 55 on another, notes that the two legs cost 97 cents to buy against a dollar of certain payout, and annualises. What none of them start from is the number that actually binds, which is how many questions exist on more than one venue at all.
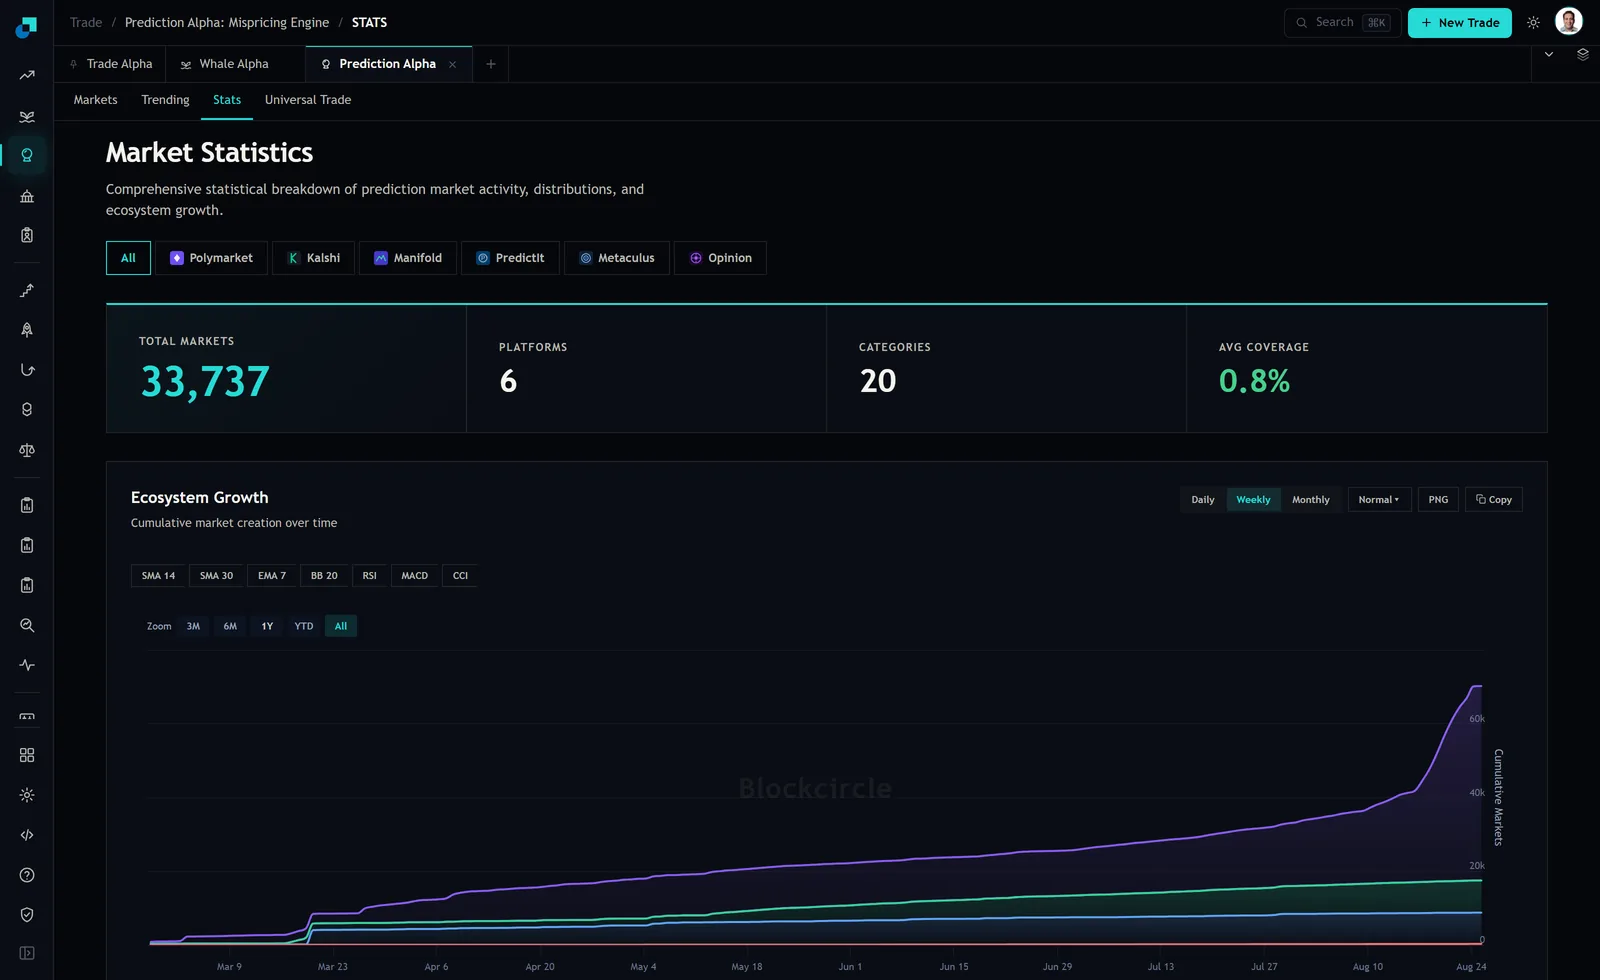
The Prediction Alpha stats tab puts that number on the screen. Total markets 33,737, platforms 6, categories 20, average coverage 0.8 percent. Before you model anything, that last tile is the constraint, and the capacity work is mostly a matter of taking it seriously.
Pin the denominator before you use the number
Three counters on this product report three different universe sizes and you should reconcile them before any of them enters a model. The stats tab says 33,737 total markets. The markets tab header says 56.2K indexed across six venues, with 1.0K displayed after filters. And on the markets tab, the Cross Match control carries a count of 79 alongside a threshold selector set to 80 percent, against those 1,000 displayed rows.
Those are not contradictions so much as different questions. One is counting a filtered set, one is counting the full index, and one is counting matches at a specific similarity threshold inside a filtered view. The operational point is that 79 out of 1,000 displayed and 0.8 percent across the whole index are two readings of the same underlying scarcity, and the gap between them is mostly the threshold and the filter. Write down which universe your capacity model is pricing, put it in the strategy document, and re-derive it yourself rather than inheriting a tile.
From a coverage rate to a count of tradable pairs
Read the 0.8 percent as the share of the indexed universe that has a counterpart elsewhere, which is the reading that matters for arbitrage, and you get roughly 270 matched questions out of 33,737. That is your entire opportunity set before a single filter that a desk would actually apply. Then apply them.
The first filter is venue eligibility, and it is more aggressive than people expect. Six venues does not mean fifteen tradable pairs. The coverage list for this module describes one venue as play-money community markets and another as a forecasting community with calibrated probabilities. A calibrated probability is a forecast, not a price, and a play-money quote is not a fill. Neither can be a leg. A third is described as academic real-money political markets, which is a category where you must confirm the current per-trader position limit before you count any of its depth, because a venue-level cap is a capacity constraint that no order book will ever show you. Work through your own venue list honestly and the count of pairs that can carry institutional size is small enough to name individually.
The second filter is spread. Most matched pairs at any moment are priced close enough that the combined cost of both legs sits at or above a dollar, which is not a trade. The third is depth, and the fourth is criteria identity, which is the one that turns an arbitrage into a directional bet without telling you.
Capacity is the thinner book, not the average book
The single most common modelling error here is averaging depth across legs. A two-leg trade is capped by the thinner side, and on this asset class the two sides are routinely orders of magnitude apart. On the markets tab the Liquidity column across four adjacent rows reads $497.3K, $686, $648.8K and $282.0K. That is not a distribution you can take a mean of. A pair whose second leg is the $686 row has a capacity of a few hundred dollars no matter what the first leg shows.
So the correct per-opportunity figure is a participation rate applied to the minimum of the two books. Pick your own rate, but something like a quarter of resting depth is where I would start, because taking more than that moves the price you are arbitraging and the edge you modelled disappears into your own footprint. Both legs need funding, and there is no cross-venue netting, so capital per opportunity is roughly twice the per-leg size and it is committed in full from entry to settlement.
Work an illustrative case with numbers you should replace with measured ones. Assume 270 matched questions, assume a third of them show a workable spread at some point in a quarter, and assume a median thinner-book depth of $25,000. A quarter of that is $6,250 a leg, $12,500 of committed capital per opportunity, across 90 opportunities. That is $1.1 million of capital at work if they all happened to be open at once, which they will not be.
Settlement dates set your capital velocity
The turnover assumption is where these models usually break, because equity and credit arbitrage instincts do not transfer. You cannot recycle capital when you find a better trade. The position is collateralised until the contract resolves, and resolution dates are set by the world, not by you. The End Date column on the markets tab shows the spread of tenors plainly, with contracts running from a few weeks out to the following January on rows that were all near the top of the same volume sort.
Take the illustrative pair above. Three cents of edge on 97 cents of committed capital is a little over three percent per cycle. If the average tenor is two months you get roughly six cycles a year, so call it twenty percent gross on deployed capital, before fees, before withdrawal and transfer costs, and before any leg that fails to behave. On $1.1 million of deployable capital that is a couple of hundred thousand dollars of gross P&L in a year.
Now put the desk cost next to it. One portfolio manager and one engineer, fully loaded at your own comp bands, plus data, plus venue and compliance overhead. For most firms that arithmetic does not close, and it does not close by a small margin.
Why adding AUM does not move the ceiling
The property that makes this strategy hard to allocate to is that capacity is fixed in dollars rather than proportional to the fund. It is set by the intersection of two order books, and a larger allocation buys you nothing because the constraint is on the other side of the screen. Every other exposure in the book scales with money. This one does not.
That changes the question an allocator should ask. Not what return the strategy makes, which is a flattering number on a small base, but what the maximum dollar P&L is in a year at full deployment, divided by the all-in cost of running it. If that ratio is not comfortably above one, the honest answer is that the strategy is a research curiosity rather than a sleeve, and it belongs as a side effect of a desk that already exists rather than as the reason to build one.
There is one more line that belongs in the memo, and it is the one that stops this being called riskless. The two legs are contracts written by two different venues under two different rule sets. Criteria can differ on the source, the cutoff time, or the treatment of an ambiguous outcome. One leg can settle before the other. Both carry venue credit risk for the life of the position. Price a haircut for the tail where a matched pair resolves against you on both sides, because that tail is what the whole strategy is short, and it is not in the spread you started from.