Every discrete regime taxonomy I have taken apart has had one class that swallowed an uncomfortable share of the history. It is usually the one with the calmest name, it is usually described as a neutral or accumulation state, and it is usually the least examined class in the whole model precisely because nothing dramatic is attached to it.
That class deserves more scrutiny than the exciting ones, not less, because it is where the model's honest answer of I do not know goes to acquire a name.
What the captured screen settles and what it does not
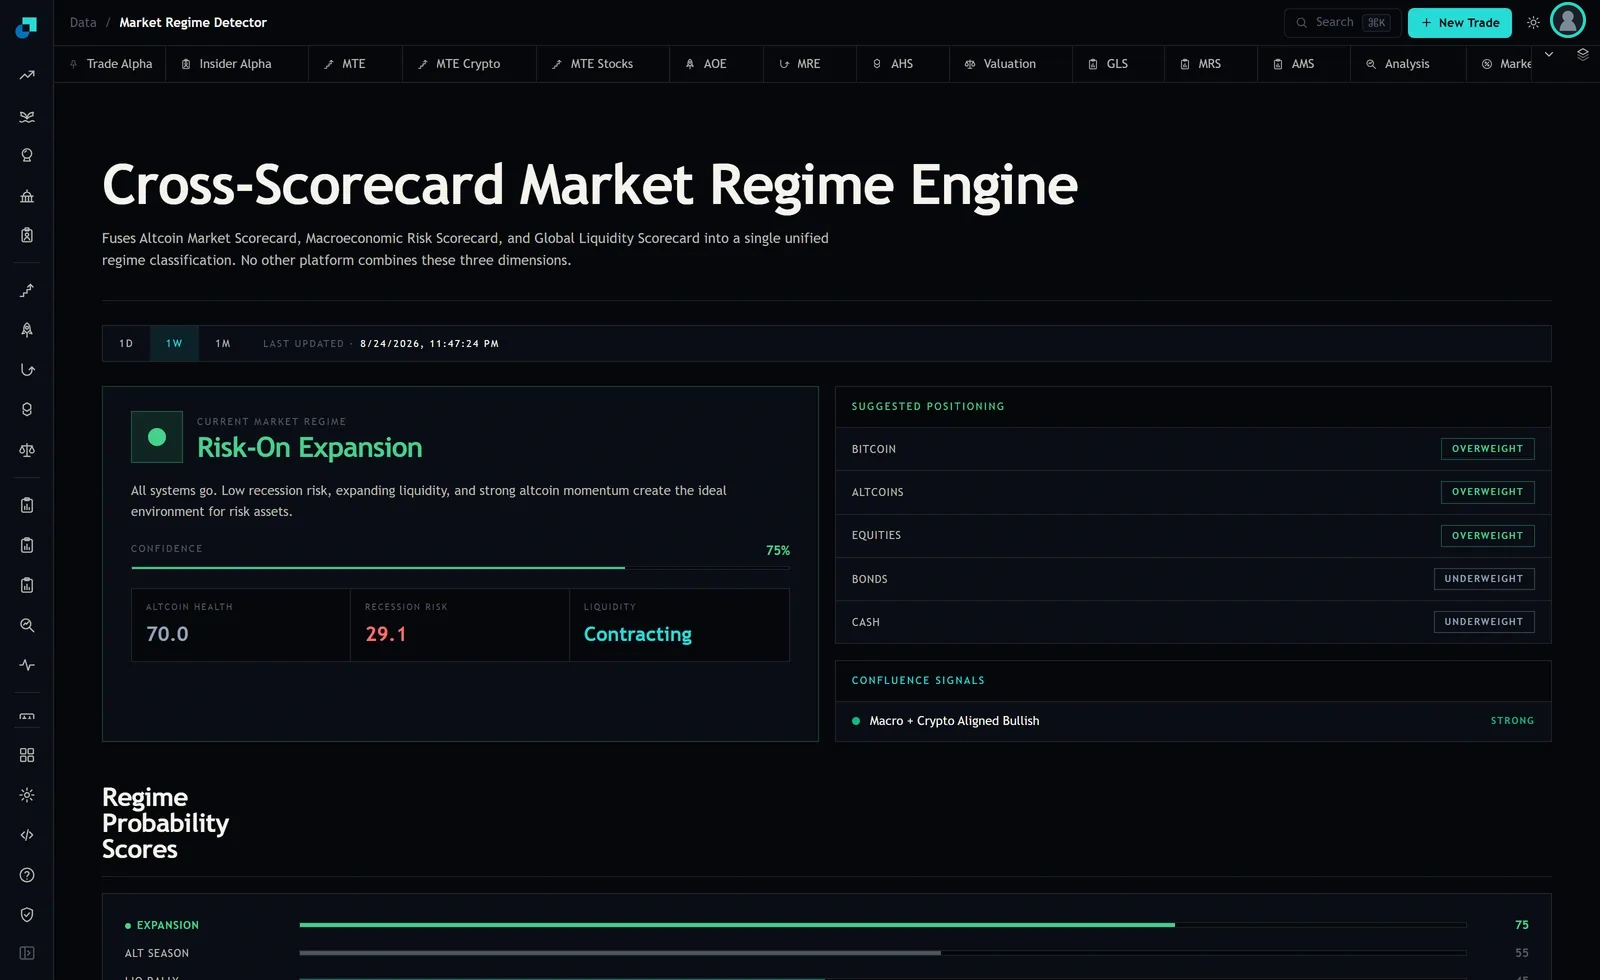
Let me be exact about the evidence, because the argument does not need exaggeration. The Market Regime Detector capture I am working from shows a current classification of Risk-On Expansion at 75 percent confidence, component readings for altcoin health, recession risk and liquidity direction, and a set of probability score bars reading Expansion 75, Alt Season 55 and Liq Rally 45.
It does not show a historical distribution of labels. There is no table of how many periods each regime has occupied, no per-regime win rate, and no per-regime return summary anywhere in the capture I have. So I am not going to quote a share for any class, and if you have seen a figure like that on your own screen, the tests below are how to interrogate it rather than a reason to accept it.
What the capture does establish is the structure that produces a dominant class in the first place, and that structure is visible in a single detail. The score bars are not a partition. Expansion at 75, Alt Season at 55 and Liq Rally at 45 already sum to well over 100 across three of them, so each score is being computed on its own scale and a separate rule decides which name gets printed on the card.
The default bucket is a property of thresholding, not a modelling mistake
Map continuous inputs to discrete labels through thresholds and you get three kinds of region. Regions where one score clears its bar cleanly. Regions where more than one does, which need a tie-break. And regions where none does, which need a fallback.
The fallback region is large by geometry alone. In a space of three continuous inputs, the volume near the middle of every axis is bigger than the corners, and market conditions spend most of their time in the middle of most axes. A dominant neutral class is therefore the expected outcome of an honestly built classifier, not evidence of laziness.
Which is exactly why share alone proves nothing. A dominant class is not disqualified by being dominant. It is disqualified by failing to distinguish its periods from the unconditional sample, and that is a testable claim rather than a rhetorical one.
Four tests, in the order I run them
The first is the distributional comparison. Take forward returns over your actual holding horizon, conditional on the class, and set them beside the unconditional distribution over all periods. Compare more than the mean. Mean, volatility, skew and the shape of the left tail. If the conditional distribution is the unconditional distribution within sampling error, the class is a relabelling of the base rate and knowing you are in it tells you nothing you did not already know from being invested at all.
The second is an information decomposition. Compute how much your uncertainty about the forward outcome bucket falls when you learn the label, and then decompose that reduction by class. This is the test that most often produces the useful finding, which is that a model with genuine aggregate information gets essentially all of it from two or three thin classes while the dominant class contributes nothing. The model is fine. The dominant class is still empty.
The third is internal heterogeneity, run in input space rather than outcome space. Measure the dispersion of the component readings within the dominant class and compare it to dispersion across the whole sample. A genuine regime is a cluster and should be internally tight. A residual bucket is defined by the absence of a condition rather than the presence of one, so its members have little in common and its within-class dispersion approaches the sample dispersion.
The fourth is membership stability. Sample periods near the class boundary and check how often they change class between model vintages. High churn concentrated in one class is a strong sign that the class is bounded by thresholds rather than by anything real.
Two columns that will mislead you before the tests do
Any per-regime summary table carries two figures that a dominant class corrupts mechanically, and both get quoted in meetings.
The win rate is the first. If a class covers half the history and the asset rose in most periods of that history, the class win rate will land close to the unconditional win rate, and it will look respectable. It is not a result. It is the market's base rate wearing a regime label. The only version of that number worth putting in a document is the difference between the class win rate and the unconditional win rate, with a standard error attached.
The best-case or maximum return column is worse, and it is worse in a way that survives being noticed. A maximum over n observations is a biased estimator that grows with n for any distribution with a tail. The class with the most periods will therefore tend to show the largest best case for arithmetic reasons alone, so a table sorted by best-case return is, to a first approximation, a table sorted by sample size. Treat any such column as descriptive colour and never as a ranking, and if a summary shows a single-period figure large enough to be surprising, that is a reason to check what window and what instrument produced it rather than a reason to repeat it.
Living with a class that fails
If the dominant class fails the distributional and information tests, you have three options and only one of them is dishonest.
The clean option is to declare it. Write into the investment process that this label means no view, that it maps to strategic weights with no tilt, and that no attribution will be claimed for periods spent in it. This costs you nothing except the illusion of coverage, and it makes the overlay far easier to defend, because you are now claiming information only where you have demonstrated it.
The second option is to re-specify. Split the residual on an axis the current taxonomy does not use, then re-run all four tests on the resulting sub-classes. Be disciplined about this. Every additional split is a hypothesis test, the sub-classes will be thin, and the temptation to keep splitting until something looks significant is exactly how a taxonomy becomes an overfit.
The third option is to keep trading the dominant class as if it carried a view because the model prints a name for it. That is the one that shows up in a post-mortem as an overlay that added turnover and no information for years, and the reason it survives so long is that nobody ever tested the class that seemed too boring to be a risk.