Moving a strategy from a charting platform into an execution engine is a data migration, and data migrations fail quietly. Nothing throws an error. The strategy lands, the table populates with a win rate and a return and a Sharpe, and the numbers look plausible because they came from a backtest that also looked plausible. The problem is that the flaws in the original backtest do not get repaired by the move. They get frozen into a row you will now treat as a fact.
I want to walk the path, name the three things that most often do not survive intact, and finish with the check that tells you within ten minutes whether your import is faithful.
Where the import lands and how you find it again
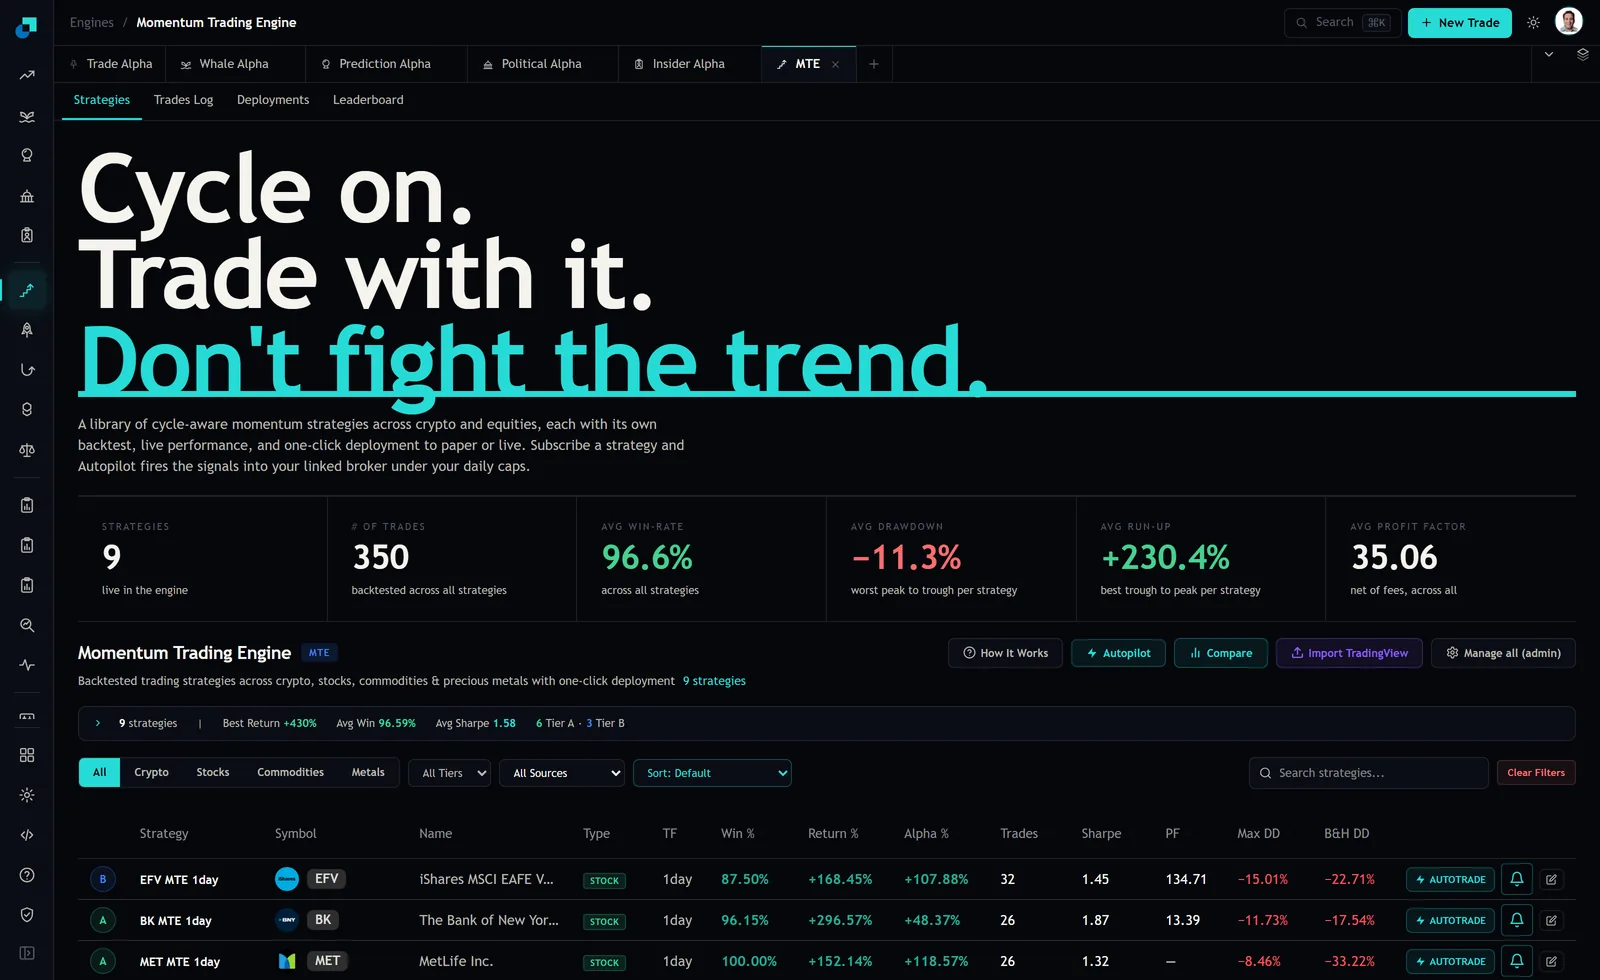
The Import TradingView action sits in the header row of the engine's Strategies tab, alongside How It Works, Autopilot, Compare and an admin-only manage control. What it lands in is the same table every other strategy lives in, which is the useful part: your import gets judged on the same columns as everything else.
Those columns, reading across, are Strategy, Symbol, Name, Type, TF, Win %, Return %, Alpha %, Trades, Sharpe, PF, Max DD and B and H DD, followed by an AUTOTRADE action per row. Above the table are asset filters for All, Crypto, Stocks, Commodities and Metals, a tier filter, a sources filter and a sort control. The sources filter is how you separate your imports from the native library later, and the trades log carries a matching Source column, which at capture held values including MTE and MTE Adopted. Provenance is tracked at the row level, so make use of it rather than relying on remembering which strategies were yours.
Repainting, the failure that arrives looking healthy
A repainting strategy is one whose historical signals differ from the signals it produced in real time. It happens when a script reads data that was not available at the moment it claims to have acted: higher-timeframe series pulled without the offset that prevents the current, unfinished bar from leaking in, or a calculation that evaluates on the developing bar and then settles somewhere else by the close.
The reason this matters more than any other item on the list is that repainting produces exactly the kind of backtest that makes someone want to import a strategy in the first place. A rule that can see a few minutes into the future will show a very high win rate and a very small drawdown, which is a description that fits a lot of appealing tear sheets.
Check it before you export, not after. Load the strategy on a chart, note the signals it shows on the last ten bars, then come back the following day and look at the same ten bars. If the marks moved, you have a repainting script and importing it will preserve the illusion in a new venue. There is no version of this that the receiving platform can detect for you, because by the time the strategy arrives, the history is just history.
Fills, and the assumption hiding inside a single bar
The second thing that does not survive intact is the fill model. A backtest run on daily bars has four prices per day. If a strategy's stop and its target are both inside one bar's range, which one filled is decided by an assumption rather than by data, and the default assumption is usually generous.
This is not academic on shorter bars either. The engine's stock signal feed at capture carried configurations running on 60m and 30m periods, both on the same instrument. A 30-minute bar contains a great deal of price action that a bar-level backtest cannot see. If your strategy uses intrabar exits of any kind, the honest thing is to re-run it with whatever finer-granularity option your charting platform offers before you export, and to note how much the result changes. If the win rate drops several points, that difference is real and it was never going to make the crossing.
Costs, and the field that is zero until you set it
Charting platforms default commission and slippage to zero. Most strategies are published without either being set, which means the published equity curve is a gross curve.
Work out what that is worth on your actual account rather than in the abstract. Take a strategy on 30-minute bars that turns over a $5,000 position two hundred times a year. If you pay five basis points a side and cross half a typical spread, call it another five, that is ten basis points a side, twenty a round trip, so 200 round trips cost about $200 on a $5,000 base. That is four percent of capital a year, spent before the strategy has an opinion. Those cost assumptions are mine and illustrative; your broker's schedule and your instrument's spread are the ones that count, and the point of the arithmetic is to make you go and look them up.
You will see the engine's own header tiles while you do this, and one of them reports an average profit factor of 35.06 described as net of fees across all strategies. Read that as a library-wide backtest aggregate over 350 backtested trades and nine strategies, roughly thirty-nine trades each, computed under the platform's own cost assumptions. It says nothing about your import and nothing about what your broker will charge you. The same goes for the 96.6% average win rate tile beside it.
The three-trade check that proves it landed
Here is the test, and it is worth doing on every single import because it takes ten minutes and it discriminates between three completely different problems.
Open your strategy's trade list on the charting platform and take the three oldest trades. Then open the engine's trades log and find the same three. Compare four fields: direction, timeframe, entry price and time. The log stamps its time column in UTC explicitly, which matters, because charting platforms typically display in exchange time or in your local time.
Now read the result. If all four agree on all three trades, your import is faithful and you can go on to argue about whether the strategy is any good. If direction and price agree but every timestamp is offset by the same whole number of hours, you have a timezone display difference and not a strategy problem, and you can correct for it once and forget it. If the entry prices differ by small amounts, the two platforms are pricing from different data sources or different venues, and every performance number will drift apart over time in a way that is nobody's fault and is still yours to live with. If the trades are not there at all, or the count is wrong, the strategy that landed is not the strategy you exported and nothing downstream is worth reading.
One last thing to check on the way past. That same log carried an amber banner at capture stating that 44 of its rows had been reconstructed by replaying the strategy over historical candles, with no order placed and no fill occurring for them. Before you count your three matched trades as evidence of anything, confirm whether the rows you matched are real fills or reconstructions. A reconstructed row agreeing with a backtest row proves that two simulations agree, which is a much weaker claim than the one you were trying to make.