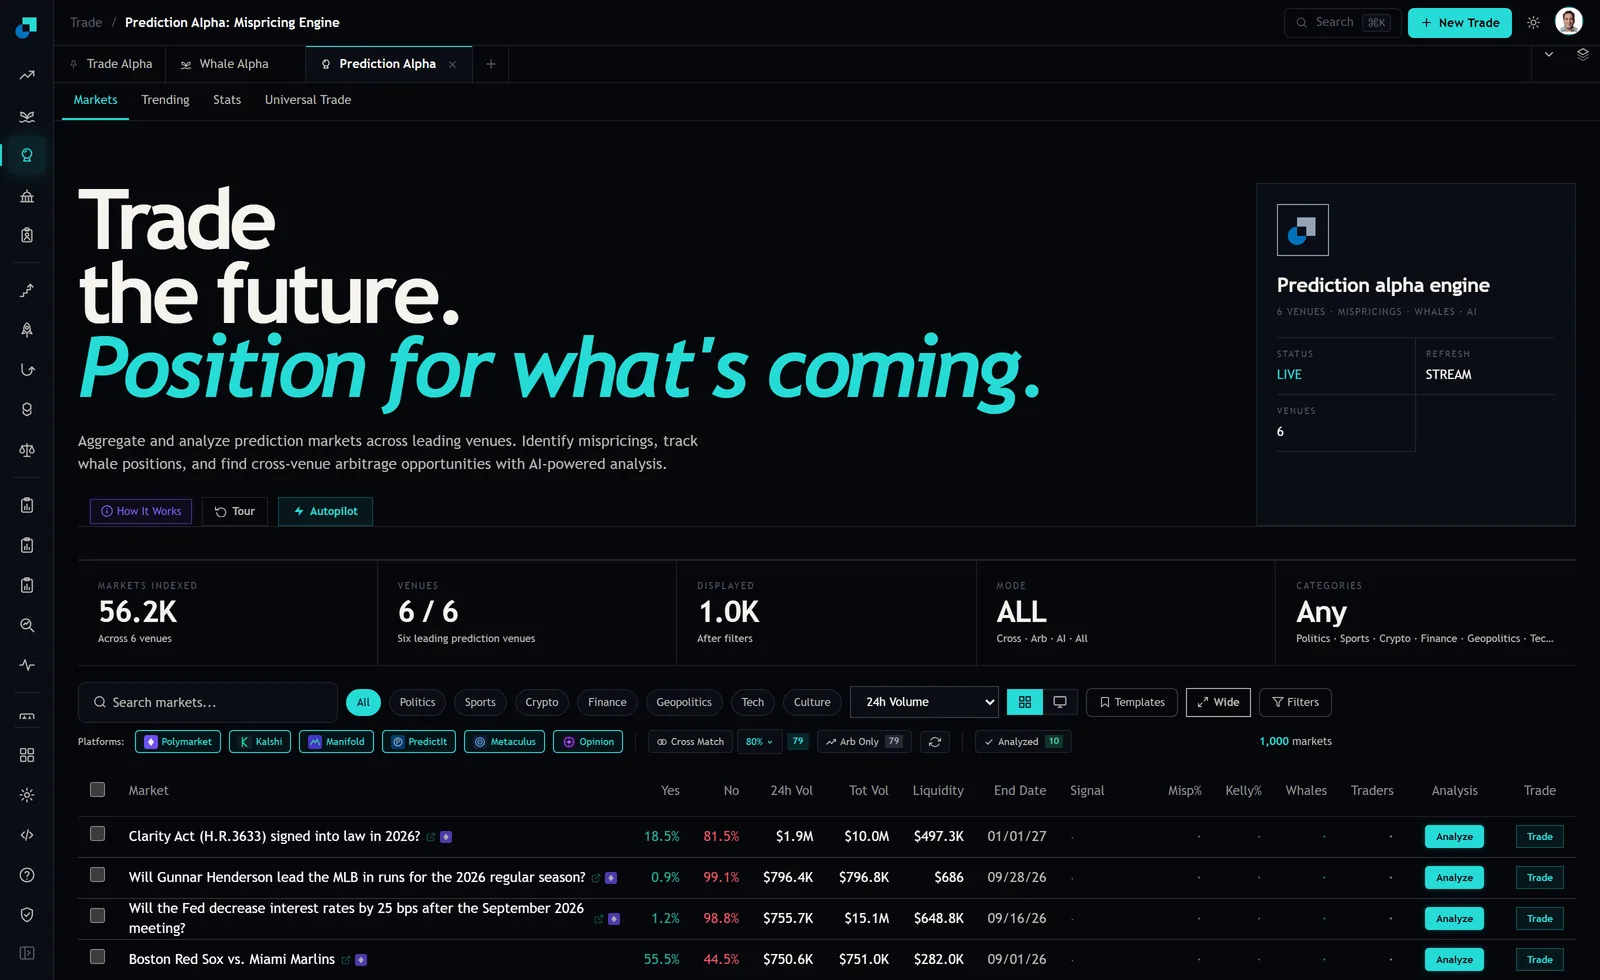
The Prediction Alpha markets table has a row on it that I use whenever someone tells me a market is liquid because it trades a lot. The question is whether Gunnar Henderson leads the MLB in runs for the 2026 regular season. Yes is quoted at 0.9 percent, No at 99.1 percent, and the 24h Vol column reads $796.4K. Close to eight hundred thousand dollars changed hands on that contract in a single day.
The Liquidity column on the same row reads $686. Not six hundred and eighty six thousand. Six hundred and eighty six dollars. That row is doing roughly eleven hundred times its own book depth in daily turnover, and if you walk in with a $500 order you are asking to buy most of what is resting on the screen.
Two columns that measure different tenses
The confusion is built into the way every screener presents this. Volume and liquidity sit next to each other in the same row, in the same font, both denominated in dollars, and they describe completely different things.
Volume is history. It is a record of trades that already cleared, at prices that are already gone, against depth that has already been consumed. It tells you that people were here. Liquidity is present tense. It is an estimate of what is resting right now, waiting for someone to hit it. It tells you whether anyone is here at this moment, at a price, in size you care about.
The table gives you a third column that sharpens this, which is Tot Vol, the lifetime figure. On the Henderson row Tot Vol reads $796.8K against 24h Vol of $796.4K. Effectively every dollar that contract has ever traded, traded in the last twenty four hours. The market has no history. It has one day. Compare that to the Fed row two lines down, where $755.7K of 24-hour volume sits inside $15.1M of lifetime volume, meaning the last day was about five percent of the contract's life. One of those is an established book having a busy session. The other is a burst.
The ratio, run across four live rows
Take the four rows visible at the top of the table, sorted by 24h Volume, and divide turnover by depth. The volume figures are all within a factor of about two and a half of each other. The depth figures are not.
| Market | 24h Vol | Liquidity | Turnover to depth |
|---|---|---|---|
| Clarity Act (H.R.3633) signed into law in 2026? | $1.9M | $497.3K | about 4x |
| Will Gunnar Henderson lead the MLB in runs? | $796.4K | $686 | about 1,160x |
| Fed decreases rates 25 bps in September? | $755.7K | $648.8K | about 1.2x |
| Boston Red Sox vs. Miami Marlins | $750.6K | $282.0K | about 2.7x |
Three of these rows sit in single digits. One of them is three orders of magnitude away from the others. If you sorted this table by 24h Volume, which is the default sort in the dropdown above the header row, all four look like peers. They are not peers. Two of them will absorb a real order and one of them will not absorb lunch.
Why depth vanishes on a contract quoted at 0.9 cents
The Henderson row is not a glitch, and the same shape shows up on any deep out of the money binary. Think about what you are asking a market maker to do when you ask for size on a contract trading at 0.9.
To offer you Yes at a penny, they are taking on ninety nine cents of downside for one cent of upside. They need to be right something like ninety nine times out of a hundred to break even on that quote, and they are quoting into a market where the news that moves it is exactly the news they do not have. So they quote a token amount and step back. There is also nowhere for them to hide. With a one cent minimum increment, the entire range between certainty and a penny is a single tick, so there is no space to shade a quote. The rational response is to keep almost nothing resting.
Meanwhile the flow keeps coming. A season-long stat attached to a live baseball season collects small directional tickets all day from people who do not check depth, and every one of them clears against whatever happens to be sitting there. Whatever exact construction the venue uses for that Liquidity column, a thousand-fold gap between what traded and what is resting is telling you the same story either way. The book is being eaten as fast as it appears.
What $686 of book actually supports
My working rule is that a single order should stay under about five percent of the quoted depth. It is a rough number and I am not going to dress it up as anything more, but it keeps me on the right side of the arithmetic. On $686 of liquidity that gives you a thirty four dollar position. Thirty four dollars is not a position, it is a rounding error, and that is the useful answer. This row is not tradable at retail size regardless of how good your view on Gunnar Henderson is. The thesis is irrelevant because the venue cannot express it.
Run the same rule down the column and the picture changes completely. Five percent of the Fed row's $648.8K is about thirty two thousand dollars. Five percent of the Clarity Act row's $497.3K is roughly twenty five thousand. Those are rows where a retail account can take a real position and expect to get filled somewhere near the screen.
The sequencing matters more than the number. Decide your size first, then read the Liquidity column, and let the column veto the trade. If you read the thesis first, get interested, and only then check depth, you will negotiate with yourself. That is how people end up paying five cents for a one cent asset and calling it conviction.
Do the same check on the exit, because that is where it bites. Assume that some meaningful share of the time you will want out before the contract resolves, either because you were wrong early or because you were right early and want to bank it. The depth that has to exist for that exit is the depth on the other side of the book, at a price you would accept, on a day you do not choose.
The escape hatch a binary has that a token does not
There is one genuine difference between an illiquid event contract and an illiquid token, and it is worth being precise about because it cuts both ways. The markets table carries an End Date column. The Henderson row ends 09/28/26. The Fed row ends 09/16/26. The Clarity Act row runs all the way to 01/01/27. On that date the contract settles at zero or at one hundred and the order book does not get a vote. A thin binary self liquidates. A thin token never does.
That escape hatch is real, and it comes with three conditions attached. First, you have to have sized the position so that holding it to the end is genuinely acceptable, which brings you straight back to the five percent rule. Second, your capital is parked until that date, so the same dollar edge is a very different trade over the three weeks to 09/16/26 than over the four months to 01/01/27, and the End Date column is where you check that before you commit. Third, and this is the one people forget, the outcome is often decided long before the settlement date arrives. You can end up holding a contract that is effectively resolved, worth close to nothing, with nobody willing to bid for the privilege of collecting the last half cent.
The honest version is that holding to resolution converts a liquidity problem into a discipline problem. It does not make it disappear. Most people cannot sit quietly on a losing binary for four months while it stares at them from the portfolio screen, and a plan that depends on doing so is not a plan. So the order is always the same. Read the two columns, take the ratio, and if the ratio is ugly, read the End Date and ask whether you would genuinely still own this on that day. If either answer is no, the row goes back on the board and you look at the next one.